Here are some indicators that are supposed to predict and/or depict economic activity. These indicators have been discussed in previous blog posts:
The ECRI WLI (Weekly Leading Index) was at 131.5 for the week ended January 1. From the story in the link below: “‘With the WLI climbing to a one-and-a-half-year high, the U.S. economy is firmly set to strengthen in the coming months,’ said Lakshman Achuthan, Managing Director at ECRI.”
http://www.businesscycle.com/news/press/1685/
Fortune’s Big Picture Index was at 17.59 as of December 18. This is at a level that is very near to the low of the data series; furthermore, as one can see, its gauge depicting “recession v. recovery” seems to strongly indicate “recession.”
http://money.cnn.com/magazines/fortune/storysupplement/recovery_index/index.html
The Dow Jones ESI (Economic Sentiment Indicator) is shown to be at 38.7 as of December 31, having risen steadily throughout 2009.
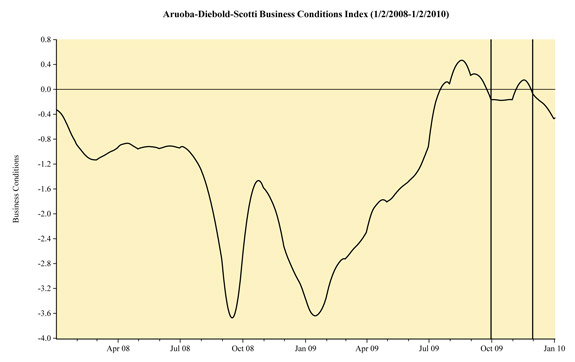
Here is the latest chart depicting the Aruoba-Diebold-Scotti Business Conditions (ADS) Index. I wrote a blog post concerning this index on October 27:
http://www.philadelphiafed.org/research-and-data/real-time-center/business-conditions-index/
Lastly, although I have not discussed the Conference Board LEI (Leading Economic Indicator), I find the chart included in this press release to be interesting. Here one can see the LEI at 104.9 for November. As seen in the December 17 Press Release (link found below), the LEI is now slightly higher than the latest peak of July 2007.
The CEI (Coincident Economic Index) is at 100.1. There is a sizable difference between the LEI and the CEI.
http://www.conference-board.org/pdf_free/economics/bci/USLEIpr_1209.pdf
SPX at 1144.98 as this post is written
