Current And Future U.S. Unemployment Situation
The unemployment situation facing the United States, especially concerning the future situation, is of critical importance. This situation will impact the entire U.S. population, not just those unemployed. While unemployment and its drivers are of critical importance, trends in wages and earnings is a related issue that has disconcerting long-term trends. Both of these aspects have strong impacts on both the U.S. economy and society as a whole.
Sustained periods of strong employment and wage growth has been a primary feature of periods in the United States in which there was widespread (and lasting) improvements in people’s economic condition and standing. During these periods much (upward) migration occurred, such as those moving into the “middle class,” culminating in a substantial “middle class” as well as other positive changes.
Given the importance of the U.S. employment situation, I have written extensively on the subject. Previous discussions are found under the “Unemployment” category, including the April 24, 2012 five-part post titled “The Unemployment Situation Facing The United States”, which discusses various problematical issues concerning the present and future employment situation.
Below is a discussion of various aspects of the U.S. unemployment situation. As this topic is vastly broad and complex, only a few topics will be discussed to avoid excessive complexity and length.
It should also be noted that the current and future unemployment situation varies widely among demographics, industries, and professions. As such, while every person’s employment situation is unique, there is enough commonality from an overall aggregate perspective as to be able to generalize to some extent.
Current U.S. Unemployment Situation
The Unemployment Rate
Currently, the U.S. economy has an official [U-3] unemployment rate of 4.1% as of the January 5, 2018 update. A long-term chart is seen below:
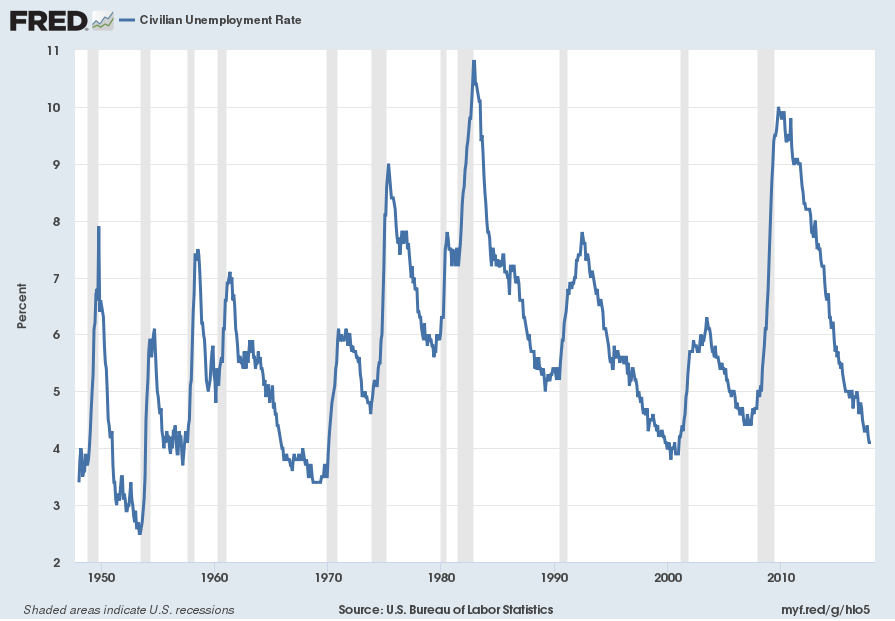
Data Source: FRED, Federal Reserve Economic Data, Federal Reserve Bank of St. Louis: Civilian Unemployment Rate [UNRATE] ; U.S. Department of Labor: Bureau of Labor Statistics; accessed January 5, 2018:
http://research.stlouisfed.org/fred2/series/UNRATE
As seen in the chart, unemployment, as defined by this measure, appears to be at a very low level from a long-term historical perspective. The unemployment rate has declined precipitously since the 2009 high.
Another widely observed measure is the U-6 rate, which is currently (as of January 5, 2018) at 8.1%, and it has also greatly declined since the year 2010 peak.
Other measures seem to indicate a “strong” job market. It is common for economists and other parties to describe U.S. employment to be at or near “full employment,” with little “slack,” and occasionally one will hear that there are looming widespread “labor shortages.” There has been an extended period of “job growth” as measured by the most prominent job measure, Total Nonfarm Payrolls. As the January 5, 2018 Wall Street Journal article (“Jobs Notch Another Robust Year“) stated:
Nonfarm payrolls rose a seasonally adjusted 148,000 in December, the Labor Department said Friday. That brought employment gains for the year to 2.1 million, the seventh straight year of increases exceeding two million. It is only the second time on record—the other being in the 1990s—when the economy has produced jobs at that pace for that long.
However, there are many aspects of the employment and unemployment situation that I find to be highly troublesome. I find various aspects of the framework, measurement, definitions, and methodologies used to calculate the statistics to be problematical. Given such problems, it is difficult to say with a high degree of certainty as to what the “actual” unemployment situation is; however, there are many indications that the very widely-held assessment that currently “employment is strong” and, as an extension, that no substantial unemployment problems exist – in reality – (substantially) lacks support.
It is unfortunate that the official (U-3) unemployment rate, depicted above, is the most prominent of unemployment measures, as the measure suffers from various shortcomings. Perhaps foremost of these shortcomings is its treatment regarding those that drop out of the labor force, which is an issue of tremendous importance.
There are other measures of the actual unemployment rate. One is seen on the ShadowStats.com site’s Alternate Unemployment Charts page. On this page, there is an interesting chart of what John Williams refers to as the “Alternate Unemployment Rate,” which he defines as:
The seasonally-adjusted SGS Alternate Unemployment Rate reflects current unemployment reporting methodology adjusted for SGS-estimated long-term discouraged workers, who were defined out of official existence in 1994. That estimate is added to the BLS estimate of U-6 unemployment, which includes short-term discouraged workers.
The U-3 unemployment rate is the monthly headline number. The U-6 unemployment rate is the Bureau of Labor Statistics’ (BLS) broadest unemployment measure, including short-term discouraged and other marginally-attached workers as well as those forced to work part-time because they cannot find full-time employment.
Here is the accompanying chart, indicating the official U-3 and U-6 measures as well as his “SGS Alternate Unemployment Rate.” One sees that there is a far different level and trajectory for the SGS Alternate rate, currently at 21.7%, vs. those of the official U-3 and U-6 rates:
Other Unemployment Measures
As discussed above, in my opinion the official methodologies used to measure the various job loss and unemployment statistics do not provide an accurate depiction; they serve to understate the severity of unemployment. However, even many of the official statistics provide an interesting (and disconcerting) long-term perspective of various unemployment aspects.
While the overall Civilian Labor Force Participation Rate (at 62.7% as of the January 5, 2018 update) remains problematical, other related measures are also problematical. One of these measures is the Civilian Labor Force Participation Rate for those ages 25-54. This age group (presumably) should not be materially impacted by those in school or those retiring. Below is the long-term chart, with a value of 81.8% as of the January 5, 2018 update:
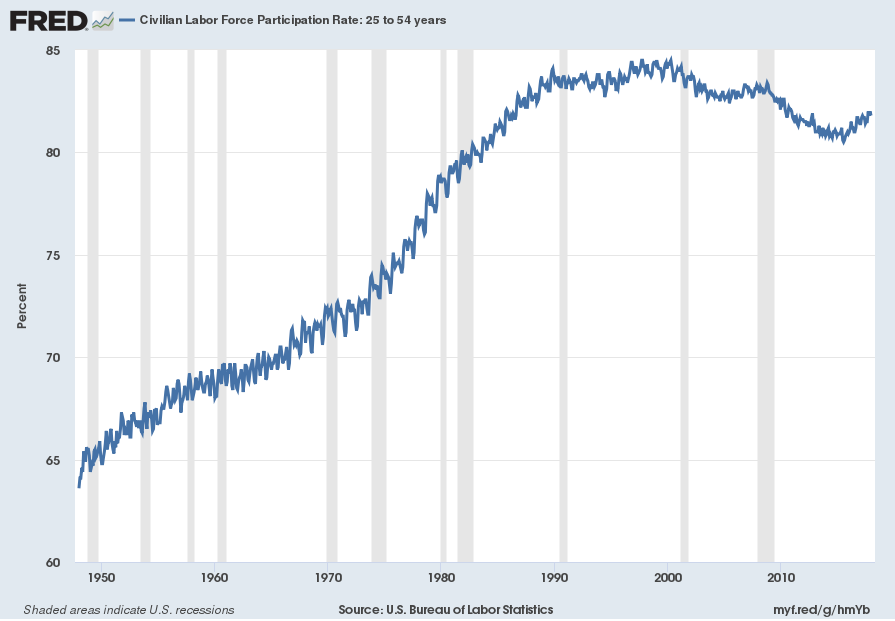
Data Source: U.S. Bureau of Labor Statistics, Civilian Labor Force Participation Rate: 25 to 54 years [LNU01300060], retrieved from FRED, Federal Reserve Bank of St. Louis; accessed January 6, 2018:
https://fred.stlouisfed.org/series/LNU01300060
Another measure is the Employment-Population Ratio for those ages 25-54. The Employment-Population Ratio is the Civilian Employed divided by the Civilian Noninstitutional Population. Among disconcerting aspects of this measure, which is at 79.1% as of the January 5, 2018 update, is the “descending peaks” aspect shown on the chart:
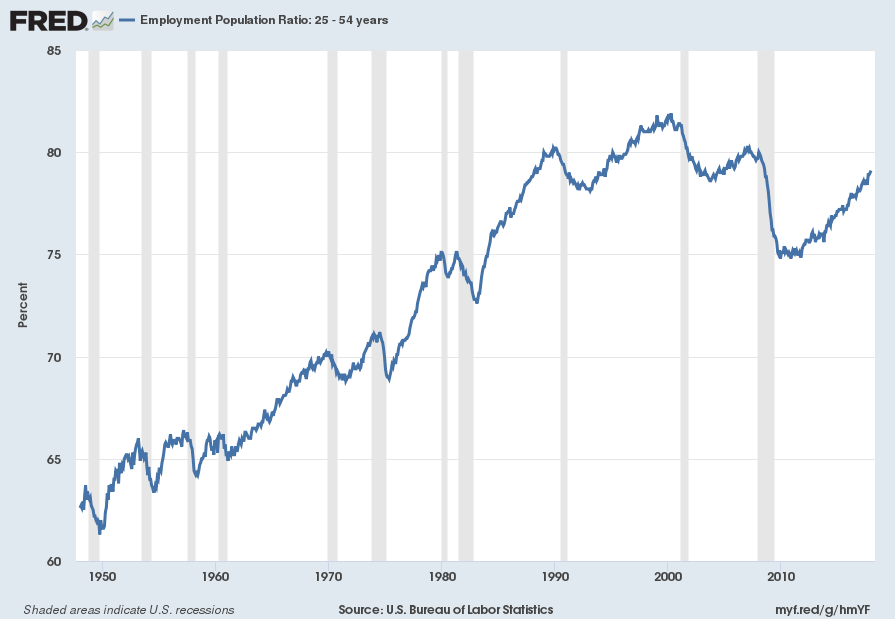
Data Source: U.S. Bureau of Labor Statistics, Employment Population Ratio: 25 – 54 years [LNS12300060], retrieved from FRED, Federal Reserve Bank of St. Louis, accessed January 6, 2018:
https://fred.stlouisfed.org/series/LNS12300060
Another disconcerting aspect of the unemployment situation is the “Not In Labor Force” statistic. I have written of this measure and its trends in the past, most recently in the December 11, 2017 “‘Not In Labor Force’ Statistic – As Of December 2017” post.
The February 9, 2015 post (“Unemployment And The ‘Not In Labor Force’ Statistic“) provides a definition of “Not In Labor Force” and further comments about this measure. One of the most notable aspects is that the measure – which is widely misunderstood on many levels – appears to exhibit an intermediate-stage parabolic trajectory from a long-term perspective. While there is no “guarantee” that this trajectory will continue to accelerate, from an “all things considered” basis the trend seems to be well-established and destined to continue. Here is the long-term chart, shown on a LOG scale, as of the January 5, 2018 update. The current value is 96.23 million people:
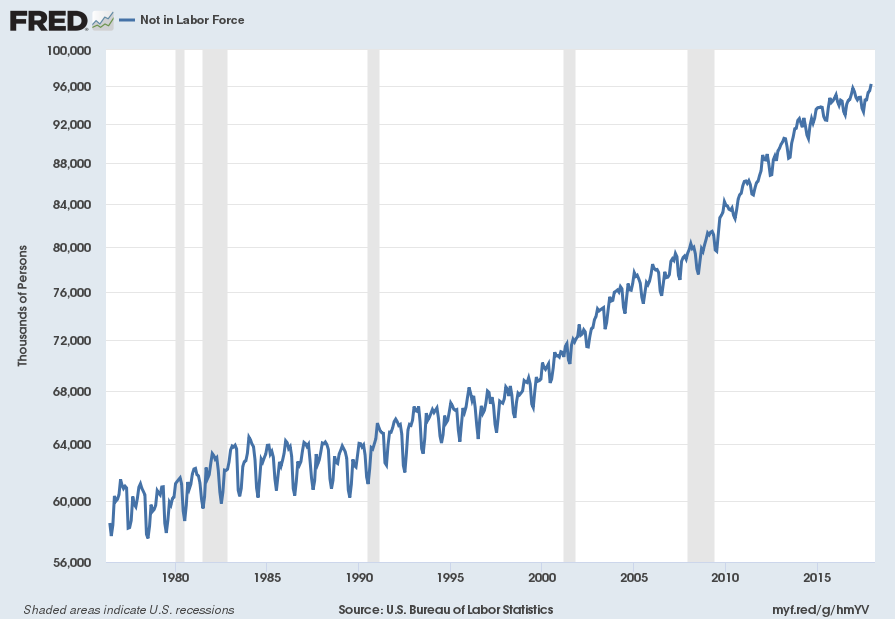
Data Source: U.S. Bureau of Labor Statistics, Not in Labor Force [LNU05000000], retrieved from FRED, Federal Reserve Bank of St. Louis; accessed January 6, 2018:
https://fred.stlouisfed.org/series/LNU05000000
Long-Term Factors Driving Unemployment
It should be noted that many different factors have led to the current unemployment and accompanying income situation. Many of these factors lack proper recognition.
Going back many decades, one of the primary factors that has reduced the need for employment is automation, first in the form of tools and machines, and later, computers and robotics. Another major factor, which appears to have come into prominence since roughly the late-80s, has been the loss of manufacturing and services to lower-cost countries.
Future U.S. Unemployment Situation
Many factors will determine the future U.S. unemployment situation. Of course, it will be highly dependent upon the overall economic environment, which in itself is highly problematical for many reasons. However, there are many other important factors as well.
Automation, in the form of robotics, algorithms, self-driving vehicles, etc. appears to be a major factor regarding the need for future labor. While many believe that “new opportunities” will present themselves to those displaced because of technology, these “new opportunities” at present lack definition. To believe that there will be the same if not more jobs created than lost due to future automation seems highly optimistic from an “all things considered” perspective.
Due to various factors, future displacement of workers by technology will probably occur even in situations where the automation is still more expensive than the worker.
Another factor that may lead to continued U.S. unemployment is continued loss of jobs to countries with cheaper labor.
From a business perspective, there are other issues as well. One of the major issues is one which I discussed in the aforementioned “The Unemployment Situation Facing The United States” post. The issue has to do with the level of overall corporate U.S. profit margins, which over the last few years have experienced substantial growth to record levels. Given the various problematical issues of the employment situation despite this increase in corporate margins (as well as increases in other metrics such as corporate revenues, stock market performance, credit market performance, etc) can strong growth in employment (and wages) be expected going forward, given a (very) likely peaking of profit margins? From an “all things considered” basis it seems rather improbable, and likely highly so.
Conclusion
While the widely-held assessment is that U.S. employment is “strong,” and that few if any substantive problems remain with regard to unemployment, the actual situation appears to lead to a far different conclusion…that of the underlying dynamics of the current – and especially future – unemployment situation remain exceedingly worrisome.
The overall U.S. employment situation is highly complex, and is driven by many different factors. These numerous factors and the overall dynamics greatly lack recognition and understanding.
As previously stated, trends in wages and earnings is a related issue that also has highly worrisome long-term trends. These worrisome trends also serve to reinforce that the levels, trends and quality of employment, from an “all things considered” standpoint, remain worrisome.
posted on January 9, 2018