Here is an update on various indicators that are supposed to predict and/or depict economic activity. These indicators have been discussed in previous blog posts:
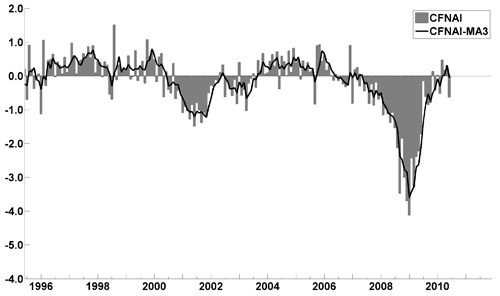
The July Chicago Fed National Activity Index (CFNAI)(pdf) updated as of July 26, 2010:
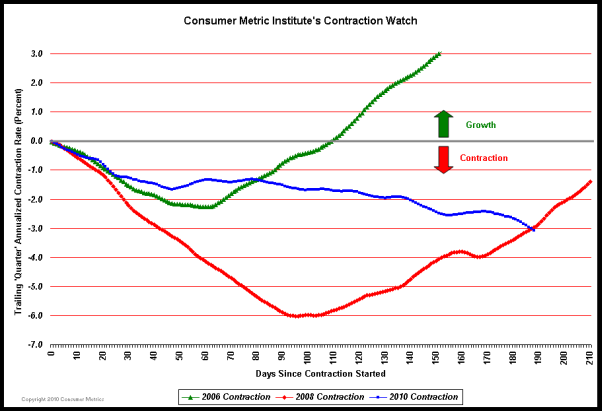
The Consumer Metrics Institute Contraction Watch:
The USA TODAY/IHS Global Insight Economic Outlook Index:
An excerpt from July 26, 2010:
“The July update of the USA TODAY/IHS Global Insight Economic Outlook Index shows real GDP growth, at a six-month annualized growth rate, slowing to 2.5% in December. The end of government stimulus spending and inventory buildup combined with continuing high unemployment, a weak housing market, tight credit and high debt are behind the slowdown.
The index predicts future real GDP growth (gross domestic product, adjusted for inflation) based on 11 leading economic and financial indicators.
Four of the 11 indicators were positive in July, down from five last month and the lowest number since USA TODAY first published the index in June 2009.”
The ECRI WLI (Weekly Leading Index):
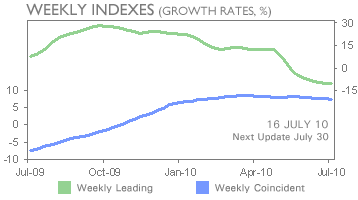
As of 7/16/10 the WLI was at 120.17 and the WLI, Gr. was at -10.5%. A chart of the Weekly Leading and Weekly Coincident Indexes:
The Dow Jones ESI (Economic Sentiment Indicator):
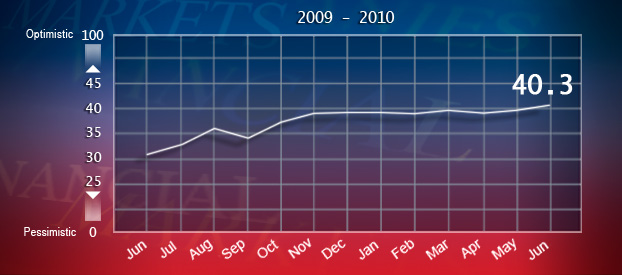
The Indicator as of June 30 was at 40.3, as seen below:
An excerpt from the June 30 Press Release:
““The ESI’s modest and steady rise over the last couple of months is a positive sign, but the U.S. is not out of the woods yet,” Dow Jones Newswires “Money Talks” Columnist Alen Mattich said. “Anxiety about the U.S.’s employment conditions and questions around Europe’s stability are key concerns that are unlikely to subside soon.”
The Dow Jones Economic Sentiment Indicator aims to predict the health of the U.S. economy by analyzing the coverage of 15 major daily newspapers in the U.S. Using a proprietary algorithm and derived data technology, the ESI examines every article in each of the newspapers for positive and negative sentiment about the economy. The indicator is calculated through Dow Jones Insight, a media tracking and analysis tool. The technology used for the ESI also powers Dow Jones Lexicon, a proprietary dictionary that allows traders and analysts to determine sentiment, frequency and other relevant complex patterns within news to develop predictive trading strategies.”
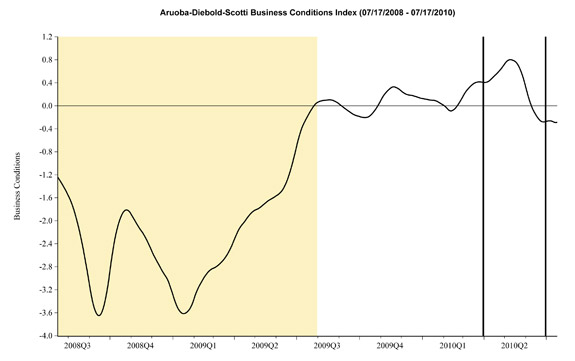
The Aruoba-Diebold-Scotti Business Conditions (ADS) Index:
Here is the latest chart, updated through 7-17-10:
The Conference Board Leading (LEI) and Coincident (CEI) Economic Indexes:
As of July 22, the LEI was at 109.8 and the CEI was at 101.4 in June.
An excerpt from the June 22, 2010 Press Release:
“”The indicators point to slower growth through the fall,” says Ken Goldstein, economist at The Conference Board.”
“New Financial Conditions Index”
I wrote a post concerning this index on 3/10/10. There is currently no updated value available.
_________
I post various indicators and indices because I believe they should be carefully monitored. However, as those familiar with this blog are aware, I do not necessarily agree with what they depict or imply.
back to <home>
SPX at 1113.68 as this post is written
