As I stated in my July 12, 2010 post (“ECRI WLI Growth History“):
For a variety of reasons, I am not as enamored with ECRI’s WLI and WLI Growth measures as many are.
However, I do think the measures are important and deserve close monitoring and scrutiny.
Below are three long-term charts, from Advisor Perspectives’ ECRI update post of June 11, 2021 titled “ECRI Weekly Leading Index Update.” These charts are on a weekly basis as of the June 11, 2021 release, reflecting data through June 4, 2021.
Here is the ECRI WLI (defined at ECRI’s glossary):
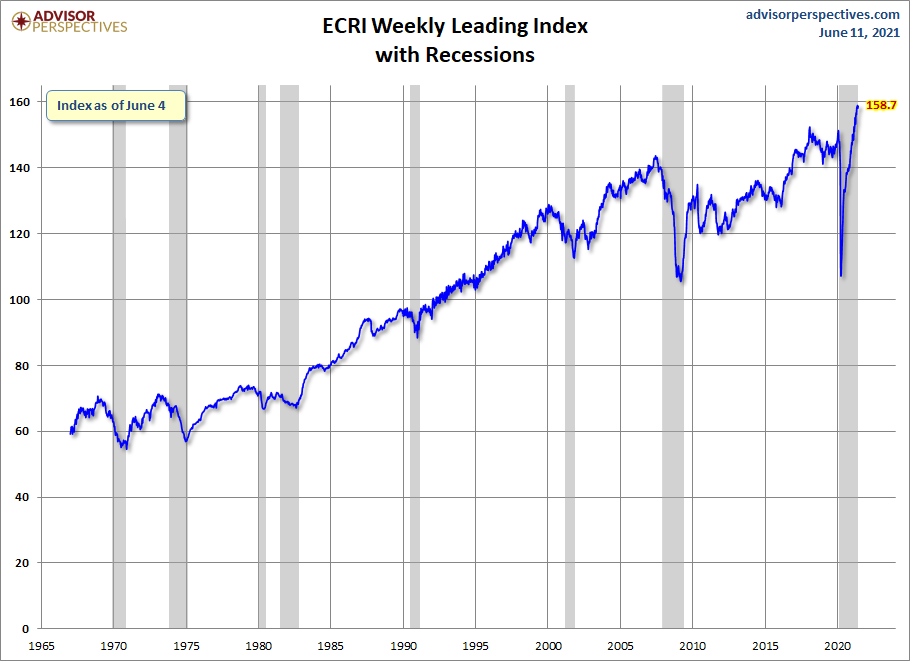
–
This next chart depicts, on a long-term basis, the Year-over-Year change in the 4-week moving average of the WLI:
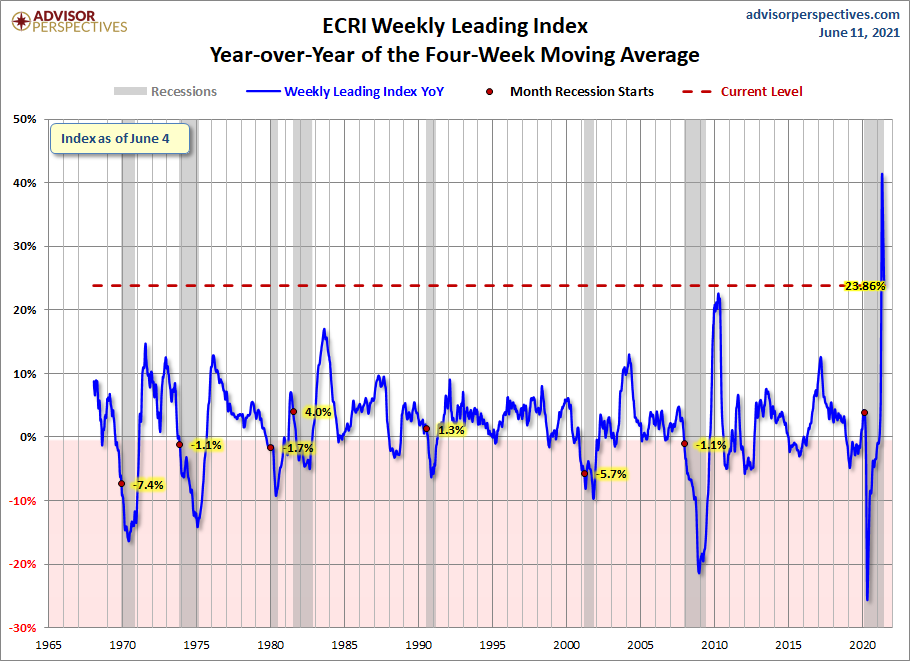
–
This last chart depicts, on a long-term basis, the WLI, Gr.:
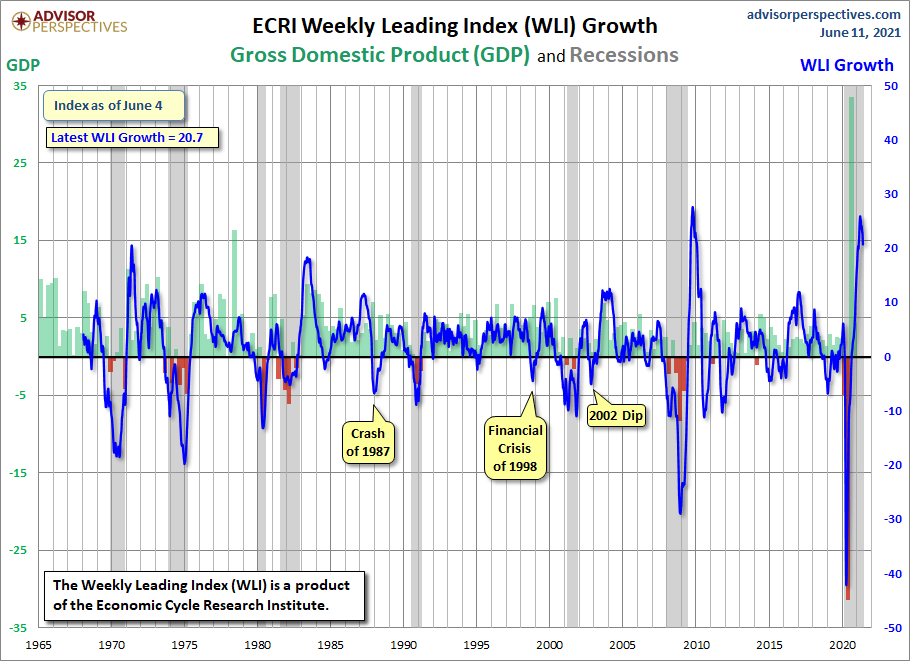
_________
I post various economic indicators and indices because I believe they should be carefully monitored. However, as those familiar with this site are aware, I do not necessarily agree with what they depict or imply.
_____
The Special Note summarizes my overall thoughts about our economic situation
SPX at 4233.13 as this post is written