Throughout this site there are many discussions of economic indicators. This post is the latest in a series of posts indicating facets of U.S. economic weakness or a notably low growth rate.
The level and trend of economic growth is especially notable at this time. As seen in various sources, recession estimates have been at elevated levels.
As seen in the April 2024 Wall Street Journal Economic Forecast Survey the consensus (average estimate) among various economists is for 1.72% GDP in 2024, 1.90% GDP in 2025, and 2.01% GDP in 2026.
Charts Indicating U.S. Economic Weakness
Below is a small sampling of charts that depict weak growth or contraction, and a brief comment for each:
The Yield Curve (T10Y2Y)
Many people believe that the Yield Curve is a leading economic indicator for the United States economy.
On March 1, 2010, I wrote a post on the issue, titled “The Yield Curve As A Leading Economic Indicator.”
While I continue to have the stated reservations regarding the “Yield Curve” as an indicator, I do believe that it should be monitored.
The U.S. Yield Curve (one proxy seen below) is (all things considered) notably inverted when viewed from a long-term perspective. Below is the spread between the 10-Year Treasury Constant Maturity and the 2-Year Treasury Constant Maturity from June 1976 through the May 3, 2024 update, showing a value of -.31% [10-Year Treasury Yield (FRED DGS10) of 4.58% as of the May 3 update, 2-Year Treasury Yield (FRED DGS2) of 4.87% as of the May 3 update]:
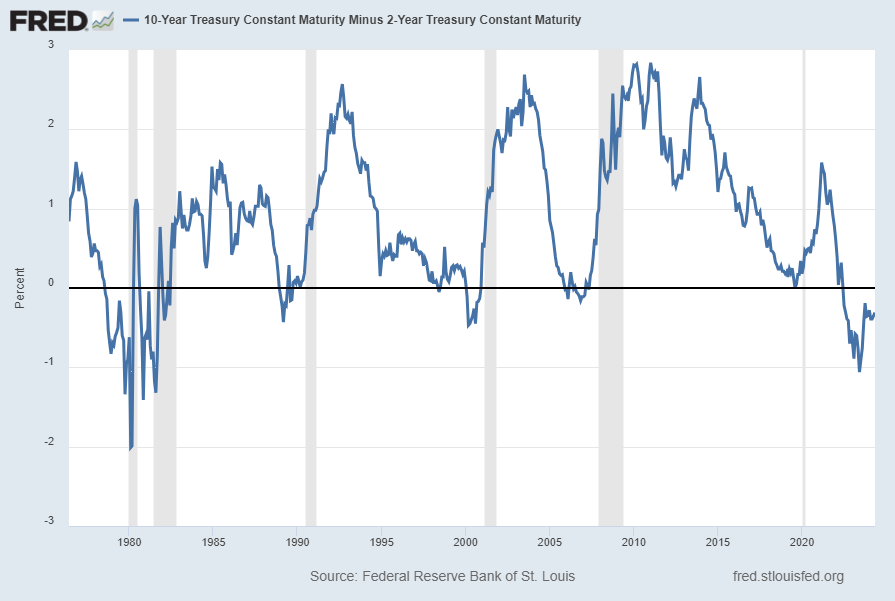
source: Federal Reserve Bank of St. Louis, 10-Year Treasury Constant Maturity Minus 2-Year Treasury Constant Maturity [T10Y2Y], retrieved from FRED, Federal Reserve Bank of St. Louis; accessed May 6, 2024: https://fred.stlouisfed.org/series/T10Y2Y
__
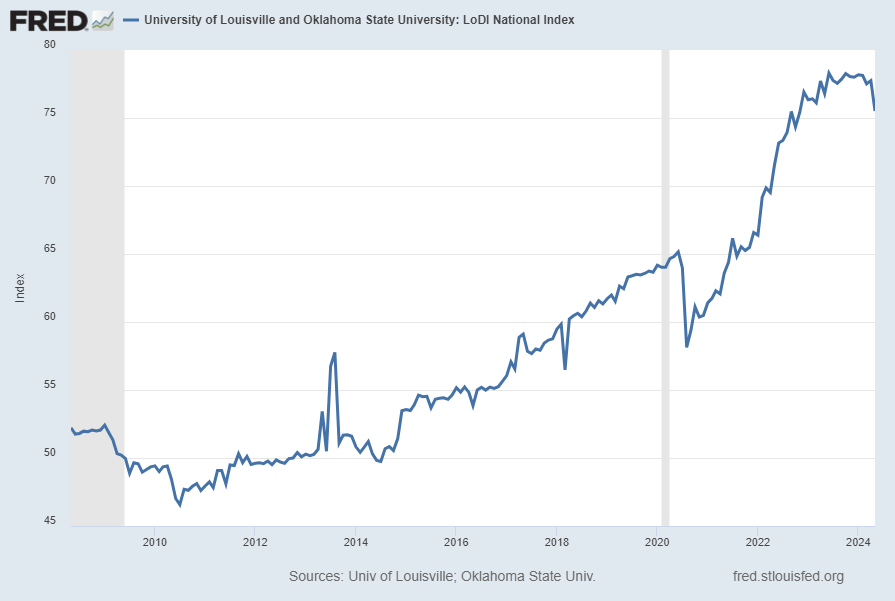
University of Louisville and Oklahoma State University: LoDI National Index (LODINIM066N)
The LoDI National Index is described in FRED as:
The LoDI Index uses linear regression analysis to combine cargo volume data from rail, barge, air, and truck transit, along with various economic factors. The resulting indicator is designed to predict upcoming changes in the level of logistics and distribution activity in the US and is represented by a value between 1 and 100. An index at or above 50 represents a healthy level of activity in the industry.
As seen in the long-term chart below, the index appears to have recently peaked.
Shown below is a chart with data through May 2024 (last value of 75.51832), last updated May 2, 2024:
Below is this measure displayed on a “Percent Change From Year Ago” basis with value -1.7%:
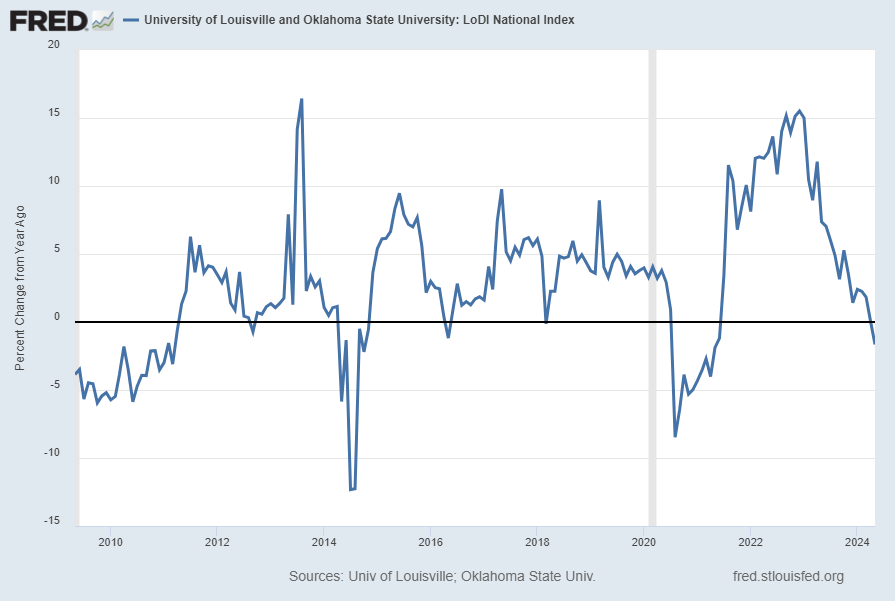
source: University of Louisville. Logistics and Distribution Institute and Oklahoma State University, University of Louisville and Oklahoma State University: LoDI National Index [LODINIM066N], retrieved from FRED, Federal Reserve Bank of St. Louis; accessed May 6, 2024: https://fred.stlouisfed.org/series/LODINIM066N
__
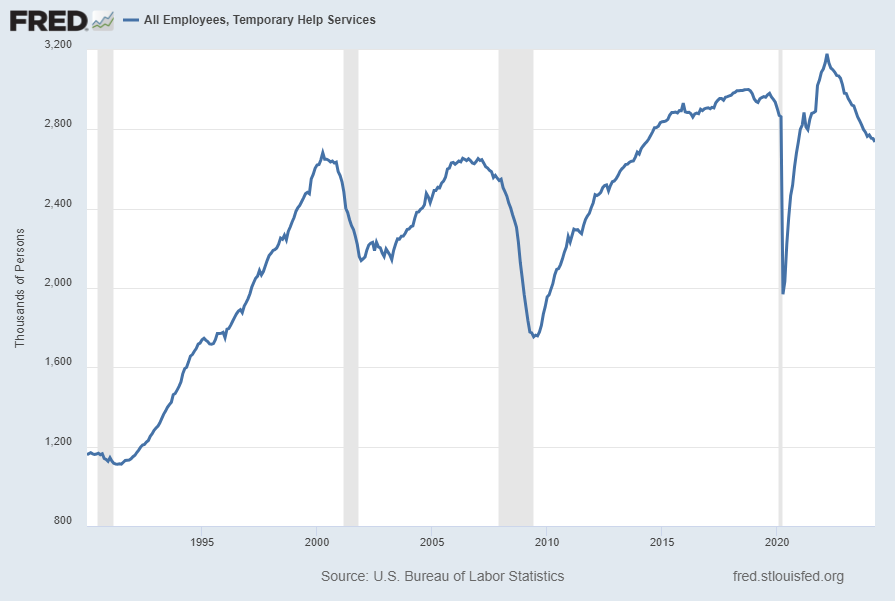
All Employees, Temporary Help Services (TEMPHELPS)
I have written extensively about many facets of employment and unemployment, as the current and future unemployment issue is of tremendous importance yet is in many ways misunderstood.
One theory regarding employment is that hiring cycles typically begin with an uptake in temporary employment. Conversely, due to various factors a reduction in temporary employees can be an (early) indicator of lessening labor demand.
Shown below is this measure with last value of 2,736.7 (Thousands) through April, last updated May 3, 2024:
Below is this measure displayed on a “Percent Change From Year Ago” basis with value -6.3%:
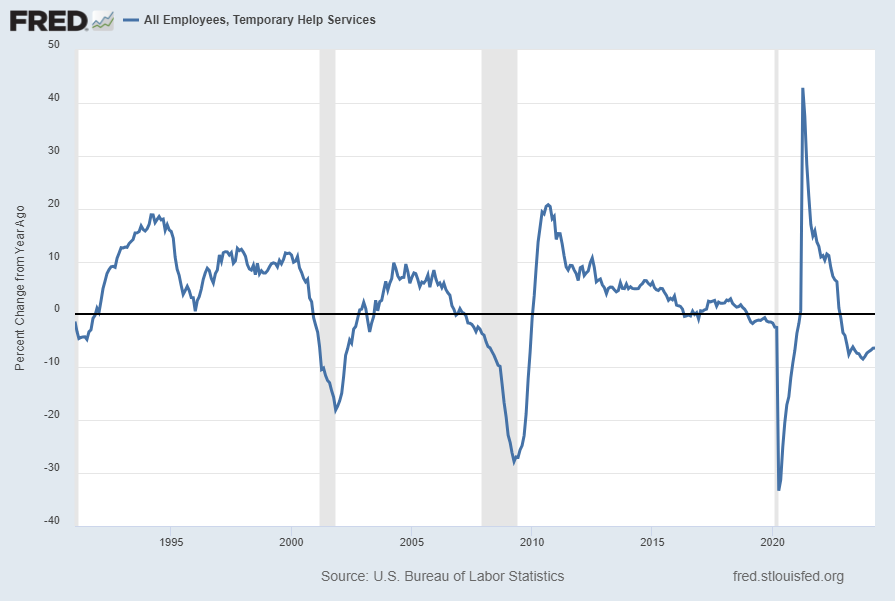
source: U.S. Bureau of Labor Statistics, All Employees, Temporary Help Services [TEMPHELPS], retrieved from FRED, Federal Reserve Bank of St. Louis; accessed May 6, 2024: https://fred.stlouisfed.org/series/TEMPHELPS
__
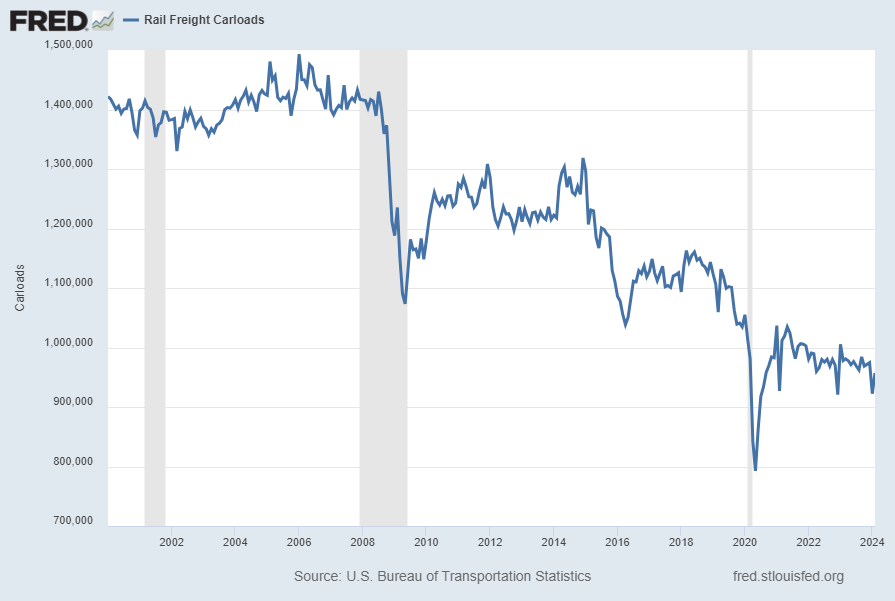
Rail Freight Carloads (RAILFRTCARLOADSD11)
“Rail Freight Carloads” continues to show a generally downward progression from a longer-term perspective. Shown below is a chart with data through February 2024 (last value of 957,197 Carloads), last updated April 10, 2024:
Here is the same measure on a “Percent Change From Year Ago” basis, with value -2.1%:
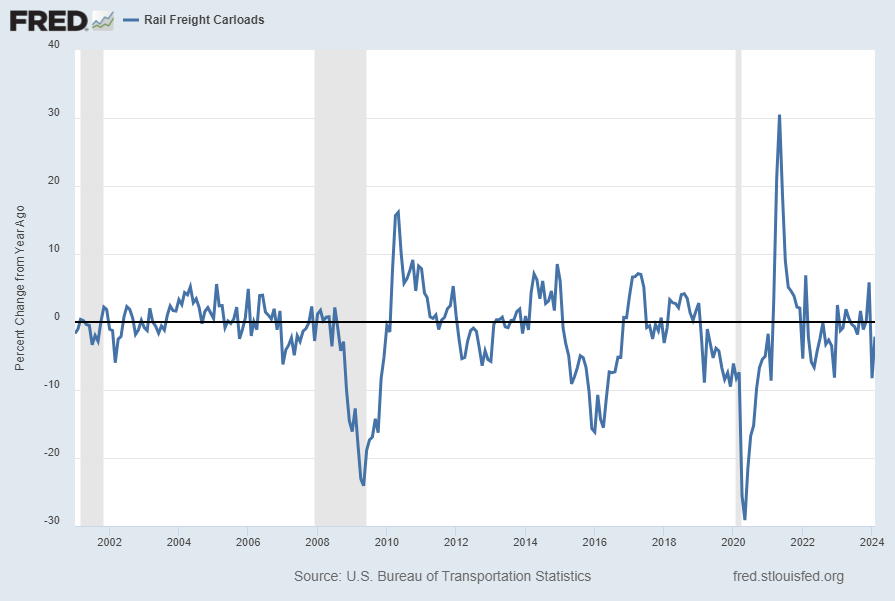
source: U.S. Bureau of Transportation Statistics, Rail Freight Carloads [RAILFRTCARLOADSD11], retrieved from FRED, Federal Reserve Bank of St. Louis; accessed May 6, 2024: https://fred.stlouisfed.org/series/RAILFRTCARLOADSD11
__
Other Indicators
As mentioned previously, many other indicators discussed on this site indicate weak economic growth or economic contraction, if not outright (gravely) problematical economic conditions.
_____
The Special Note summarizes my overall thoughts about our economic situation
SPX at 5156.83 as this post is written