In previous posts I have discussed the Bond Bubble and its many facets, as my analyses indicates that the overall bond market is an exceedingly large asset bubble with immensely large and wide-ranging economic implications.
Since my last post on the Bond Bubble (the February 6, 2013 post titled “The Bond Bubble – February 2013 Update“) I have written various posts about interest rates and associated dynamics.
It should be noted that current rates on 10-Year Treasury Yields, from a long-term historical view, remain extremely depressed. This can be seen in the following chart of 10-Year Treasury Yields:
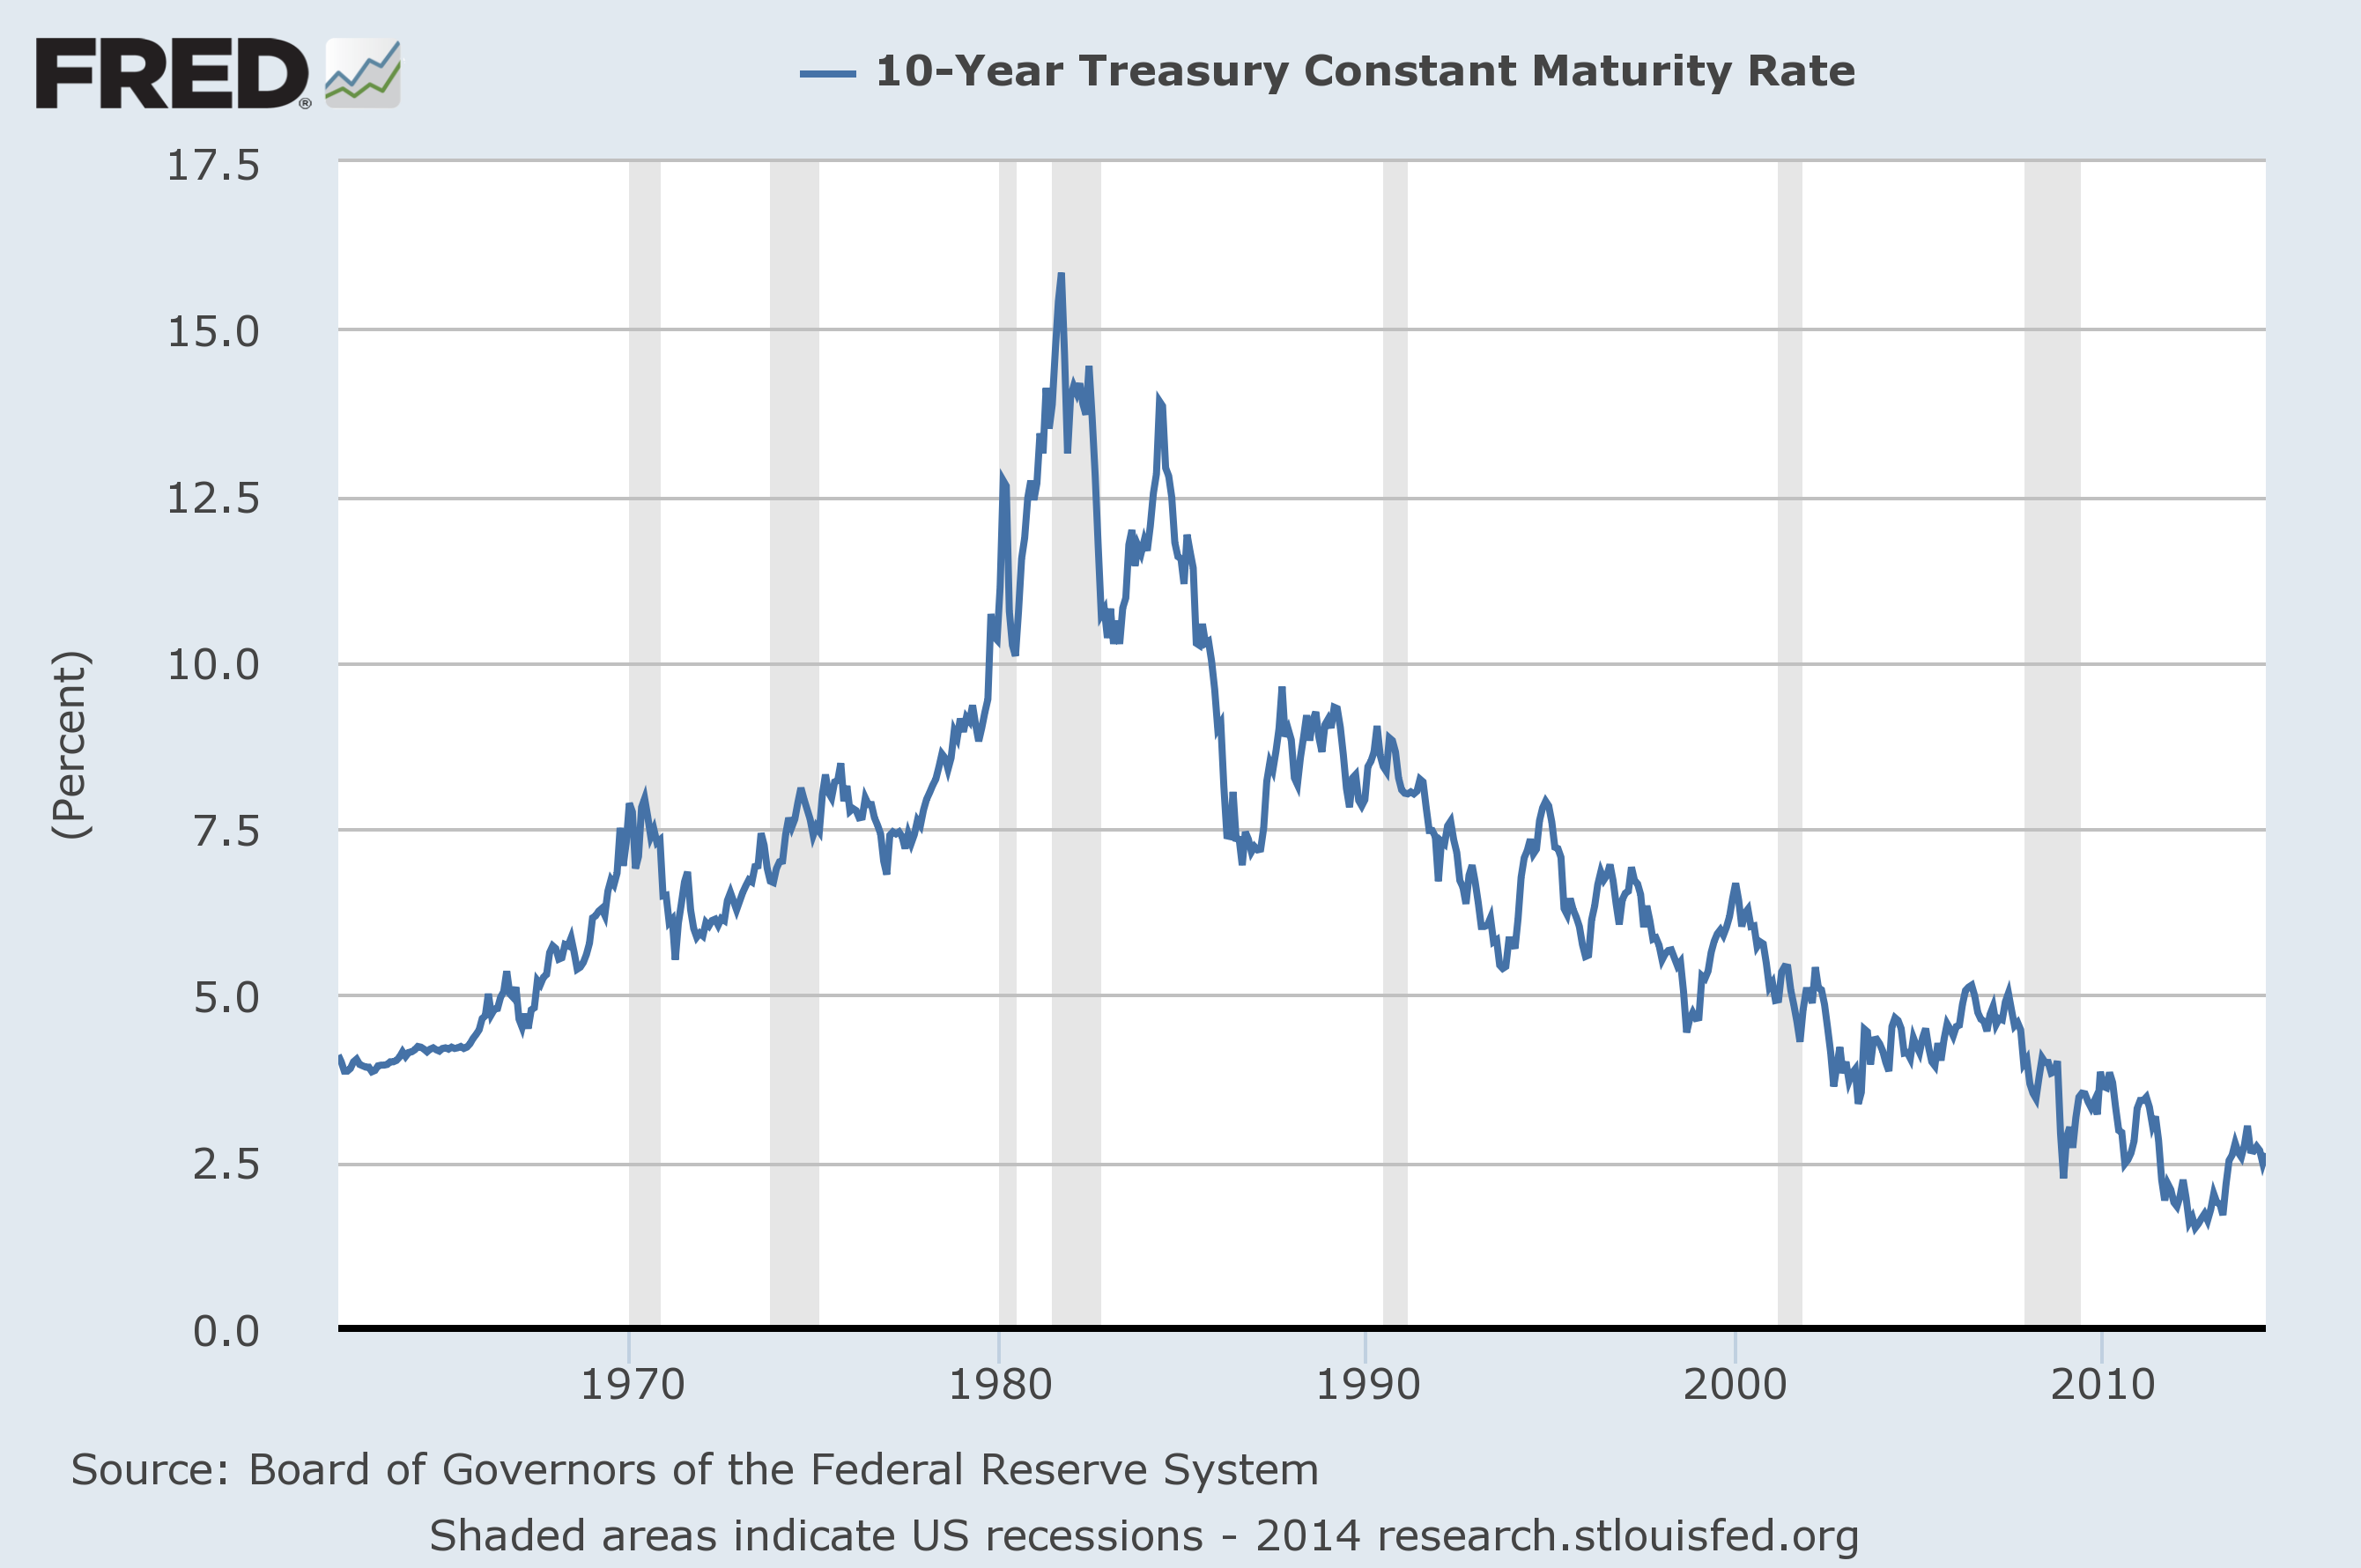
Data Source: FRED, Board Of Governors Of The Federal Reserve System; accessed June 23, 2014:
https://research.stlouisfed.org/fred2/series/DGS10
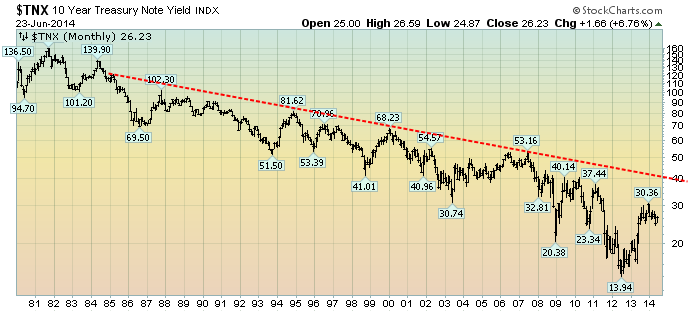
Here is another chart of the 10-Year Treasury Yield, from 1980 on a LOG scale, with a long-term trendline, and currently yielding 2.623%:
(click on chart to enlarge image)(chart courtesy of StockCharts.com; chart creation and annotation by the author)
Perhaps one of the more striking aspects of the bond environment is that although 10-Year Treasury Yields are up significantly from their lows, various interest rates on less creditworthy securities are at or near their lows. This can be seen in various securities and bond segments, both domestically and internationally, including the BofA Merrill Lynch US High Yield Master II Index chart, which shows a current yield (as of June 20, 2014) of 5.18% and its OAS Spread at 3.36%.
Of course, the question remains as to which direction interest rates, especially on the 10-Year Treasury, will take from here.
While there have been many arguments – including economic weakness – put forth that would indicate 10-Year Treasury Yields will fall from here, there are also many other (including those lesser-recognized) factors that indicate that the next sustained move on 10-Year Treasury Yields will continue upward. While the “up vs. down” argument is complex, my analyses indicate that the trend in the 10-Year Treasury Yield will continue upward.
As I have explained in previous posts on interest rates and the Bond Bubble, such as the August 22, 2013 post “The Impact Of Rising Interest Rates,” what is particularly intimidating is the prospects for the economy and financial markets when the bond bubble finally “bursts.” While the duration of this bond bubble makes (ultra) low interest rates seem sustainable – and by extension, “natural” – my analyses indicate that this interest rate environment is nothing of the sort.
Furthermore, relative to past rising interest rate environments, due to various current dynamics the coming increase in interest rates will be far more pernicious to the overall economy.
As I stated in the aforementioned February 6, 2013 post;
The perils of this bond bubble and its future “bursting” can hardly be overstated.
_____
The Special Note summarizes my overall thoughts about our economic situation
SPX at 1962.61 as this post is written
I’d have to research further, but my guess is that the calculation is using a “spot Treasury curve” figure, not the 10-Year Treasury yield…
Why isn’t the spread (5.18 less the 10 year rate of 2.63 =) 2.55 instead of 3.35?
10-Year Treasury Constant Maturity Rate
2014-06-20: 2.63 Percent (+ see more)
Daily, Not Seasonally Adjusted, DGS10, Updated: 2014-06-23 3:31 PM CDT
The BofA Merrill Lynch Option-Adjusted Spreads (OASs) are the calculated spreads between a computed OAS index of all bonds in a given rating category and a ??? spot Treasury curve???. must not be the 2.63 above?