Here is an update on various indicators that are supposed to predict and/or depict economic activity. These indicators have been discussed in previous blog posts:
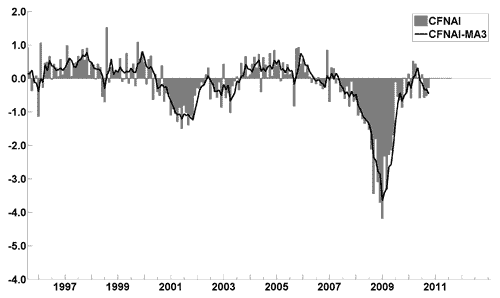
The November Chicago Fed National Activity Index (CFNAI)(pdf) updated as of November 22, 2010:
–
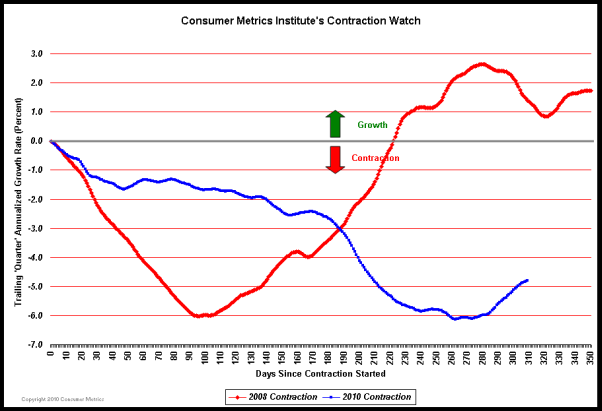
The Consumer Metrics Institute Contraction Watch:
–
The USA TODAY/IHS Global Insight Economic Outlook Index:
An excerpt from the October 27 Release, titled “Latest economic index forecasts weak growth through first quarter” :
“The October update of the USA TODAY/IHS Global Insight Economic Outlook Index shows real GDP growth, at a six-month annualized growth rate, slowing to 1.4% in October and then increasing to 2.0% in February and March, as weak housing and employment conditions continue to impede growth.”
–
The ECRI WLI (Weekly Leading Index):
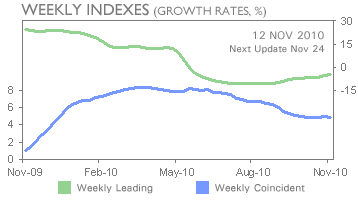
As of 11/12/10 the WLI was at 124.3 and the WLI, Gr. was at -4.5%. A chart of the growth rates of the Weekly Leading and Weekly Coincident Indexes:
–
The Dow Jones ESI (Economic Sentiment Indicator):
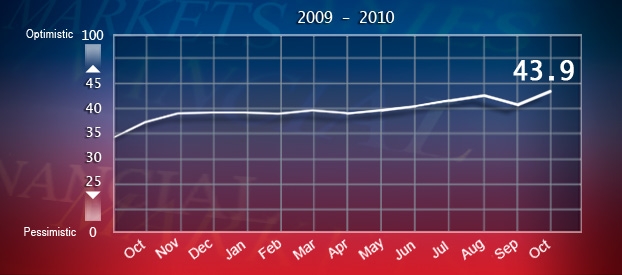
The Indicator as of November 1 was at 43.9, as seen below:
An excerpt from the November 1 release:
“The Dow Jones Economic Indicator (ESI) jumped 3.2 points to 43.9 in October, an unusually strong gain. In back-testing through 1990, election year Octobers averaged a 0.3 point rise. The ESI is now at its highest point since December 2007.
October’s gain, however, was preceded by a 2.5 point drop in September. The ESI’s turbulence implies that the economy is teetering between a slow climb up and a relapse.
“The Dow Jones ESI rebounded in October from its dip the previous month, resuming a modest upward trend seen during much of the year,” Dow Jones Newswires “Money Talks” Columnist Alen Mattich said. “The indicator, however, is still well below levels seen during normal expansions. The October number was not particularly boosted by press coverage of impending quantitative easing from the Federal Reserve or from any one off factors, supporting the view that it reflects self sustaining growth in the economy.”
–
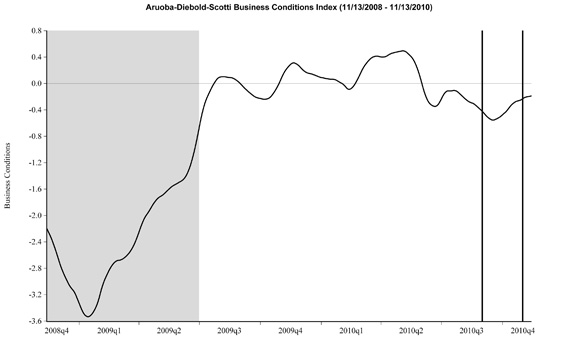
The Aruoba-Diebold-Scotti Business Conditions (ADS) Index:
Here is the latest chart, depicting 11-13-08 to 11-13-10:
–
The Conference Board Leading (LEI) and Coincident (CEI) Economic Indexes:
As per the November 18 release, the LEI was at 111.3 and the CEI was at 101.5 in October.
An excerpt from the November 18, 2010 Press Release:
“Says Ken Goldstein, economist at The Conference Board: “The economy is slow, but latest data on the U.S. LEI suggest that change may be around the corner. Expect modest holiday sales, driven by steep discounting. But following a post-holiday lull, the indicators are suggesting a mild pickup this spring.”
_________
I post various indicators and indices because I believe they should be carefully monitored. However, as those familiar with this blog are aware, I do not necessarily agree with what they depict or imply.
A Special Note concerning our economic situation is found here
SPX at 1197.84 as this post is written
