This post is a brief update to various past commentaries concerning the stock market bubble, most notably the February 2020 page titled “The Immense Stock Market Bubble And Characteristics.”
The stock market bubble continues to grow in size, which is highly notable given the enormous size of the bubble during February 2020. My analyses indicate that this stock market bubble is the largest stock market bubble ever in the United States. As well, another problematic aspect is that the stock market bubble is just one of many exceedingly large asset bubbles in existence. The existence of these astoundingly large asset bubbles poses a grave risk to the financial system and economy.
I have written extensively concerning the stock market bubble, its causes, and current and future consequences. It should be noted that a fully comprehensive discussion would be exceedingly lengthy and at times very complex. Perhaps the paramount aspects of this stock market bubble is that, for various reasons, it is far larger than most conventional measures would suggest; and that the future consequences of the “bursting” of the bubble will be highly problematical on many fronts.
As stated in the February 2020 commentary, one of the foremost signs of asset bubbles is excessive sentiment. Excessive sentiment can manifest in many ways. The current stock market environment exhibits a broad array of excessively positive sentiment. This excessively positive sentiment is often referred to as excessive speculation or “froth.” The current stock market is experiencing an epochal speculative mania.
In the February 2020 commentary I displayed a variety of long-term charts that depicted notable fundamental and technical measures. Below is an update to three of those charts, the S&P500, the XLK ETF, and the Nasdaq 100. The XLK and Nasdaq 100 illustrate the outsized price appreciation of perhaps the most overvalued market segment, technology.
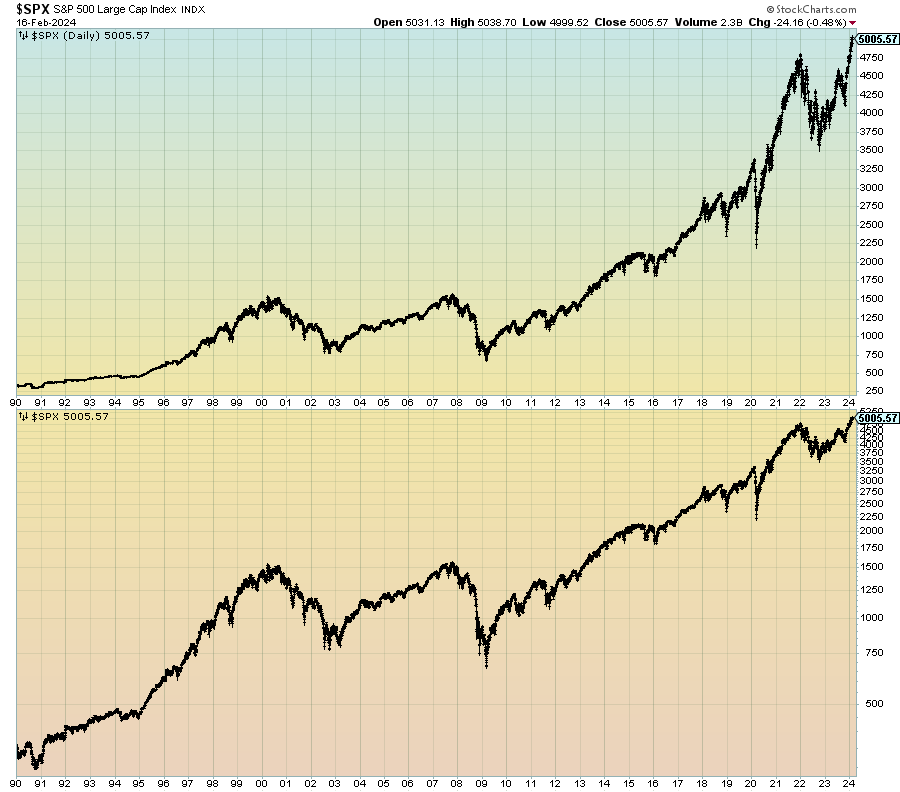
Shown below is the S&P500 daily chart since 1990, with prices displayed on a linear scale on the top plot and a LOG scale on the bottom plot:
(click on charts to enlarge images)(charts courtesy of StockCharts.com; chart creation and annotation by the author)
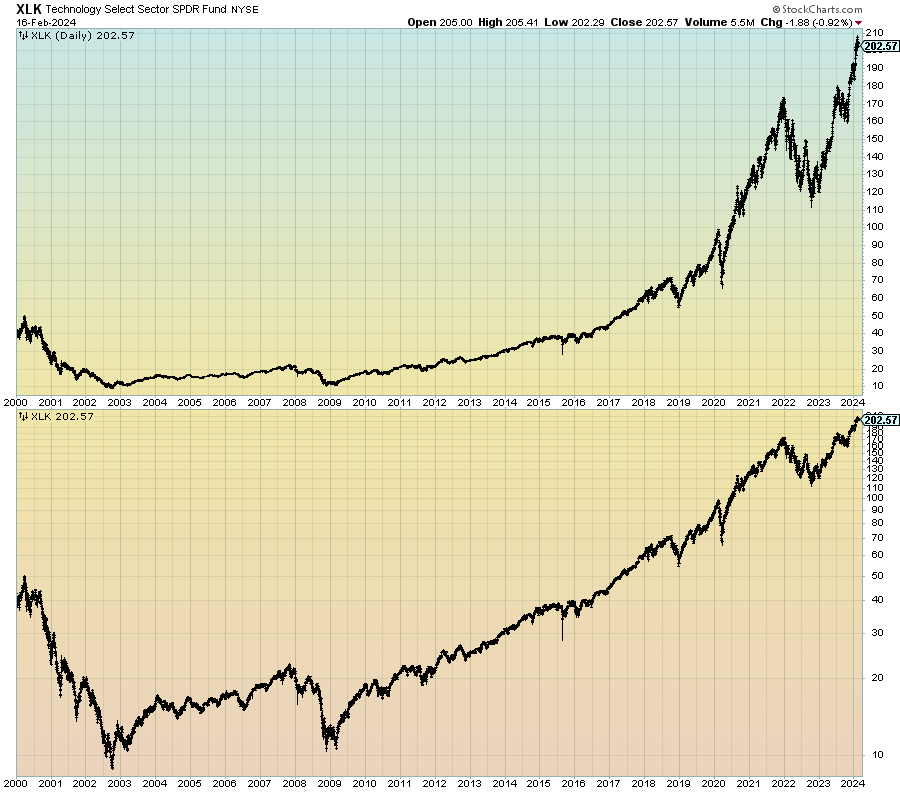
Here is the XLK (technology) ETF since the year 2000, shown on a linear price scale (top plot) and a LOG scale (bottom plot):
(click on chart to enlarge image)(charts courtesy of StockCharts.com; chart creation and annotation by the author)
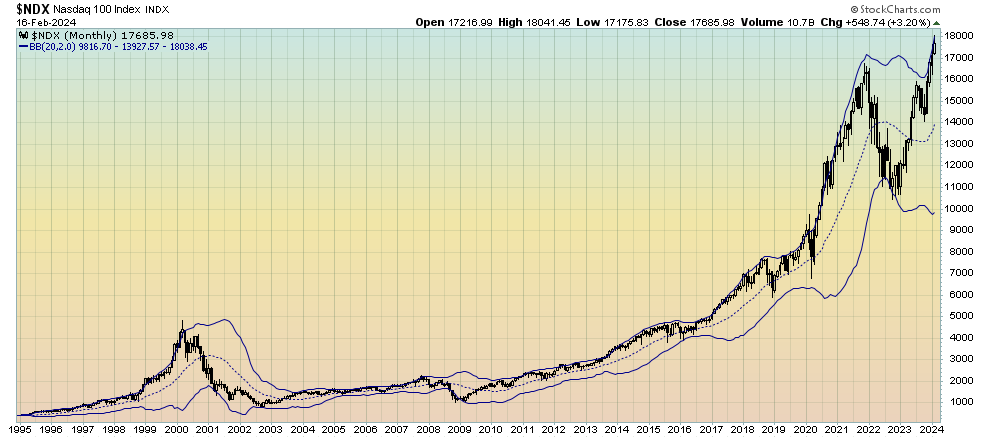
From a technical analysis perspective, many indicators show highly unique readings. Among these are the Bollinger Bands seen in the Nasdaq 100 chart, demonstrating the outsized velocity of recent price increases. As seen in the monthly chart below, the price has strongly rebounded since mid-2022 and is once again at the upper Bollinger Band:
(click on chart to enlarge image)(charts courtesy of StockCharts.com; chart creation and annotation by the author)
Another indication of a highly elevated level of froth is the extreme excessive valuations and accompanying very rapid price advance of scores of individual stocks both in technology as well as other sectors.
As I have mentioned in previous commentaries, the “bursting” of this stock market bubble will have many adverse impacts. My analyses continue to indicate this popping of the bubble will occur during a crash.
As I have previously written, most recently in “The U.S. Economic Situation” updates:
My analyses continues to indicate that the growing level of financial danger will lead to the next stock market crash that will also involve (as seen in 2008) various other markets as well. Key attributes of this next crash is its outsized magnitude (when viewed from an ultra-long term historical perspective) and the resulting economic impact. This next financial crash is of tremendous concern, as my analyses indicate it will lead to a Super Depression – i.e. an economy characterized by deeply embedded, highly complex, and difficult-to-solve problems.
_____
The Special Note summarizes my overall thoughts about our economic situation
SPX at 5005.57 as this post is written