Throughout this site there are many discussions of economic indicators. This post is the latest in a series of posts indicating facets of U.S. economic weakness or a notably low growth rate.
The level and trend of economic growth is especially notable at this time. As seen in various sources, recession estimates have been at high levels.
As seen in the July 2023 Wall Street Journal Economic Forecast Survey the consensus (average estimate) among various economists is for .97% GDP in 2023, 1.26% GDP in 2024, and 2.08% GDP in 2025.
Charts Indicating U.S. Economic Weakness
Below is a small sampling of charts that depict weak growth or contraction, and a brief comment for each:
The Yield Curve (T10Y2Y)
Many people believe that the Yield Curve is a leading economic indicator for the United States economy.
On March 1, 2010, I wrote a post on the issue, titled “The Yield Curve As A Leading Economic Indicator.”
While I continue to have the stated reservations regarding the “Yield Curve” as an indicator, I do believe that it should be monitored.
The U.S. Yield Curve (one proxy seen below) is negative and is (all things considered) notably negative when viewed from a long-term perspective. Below is the spread between the 10-Year Treasury Constant Maturity and the 2-Year Treasury Constant Maturity from June 1976 through the August 7, 2023 update, showing a value of -.67% [10-Year Treasury Yield (FRED DGS10) of 4.05% as of the August 7 update, 2-Year Treasury Yield (FRED DGS2) of 4.78% as of the August 7 update]:
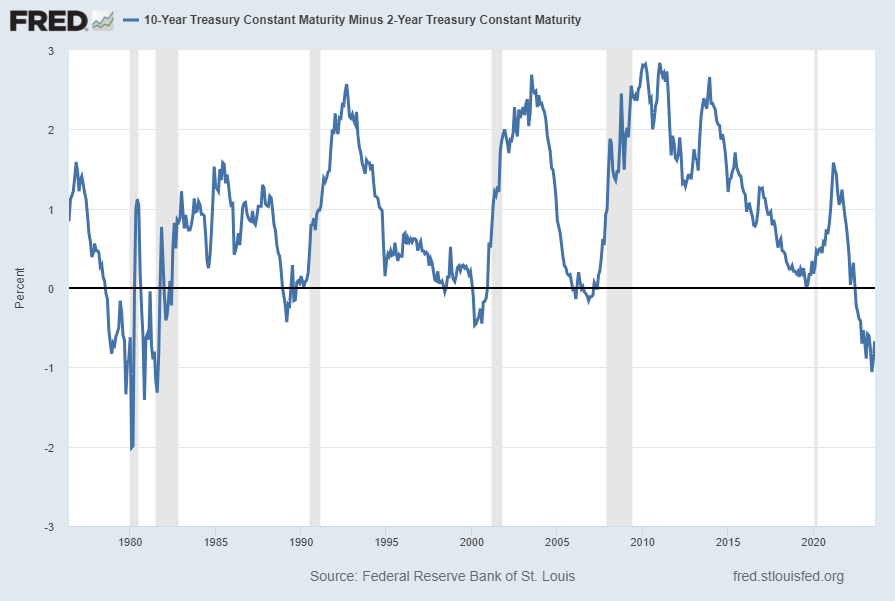
source: Federal Reserve Bank of St. Louis, 10-Year Treasury Constant Maturity Minus 2-Year Treasury Constant Maturity [T10Y2Y], retrieved from FRED, Federal Reserve Bank of St. Louis; accessed August 7, 2023: https://fred.stlouisfed.org/series/T10Y2Y
__
Truck Tonnage (TRUCKD11)
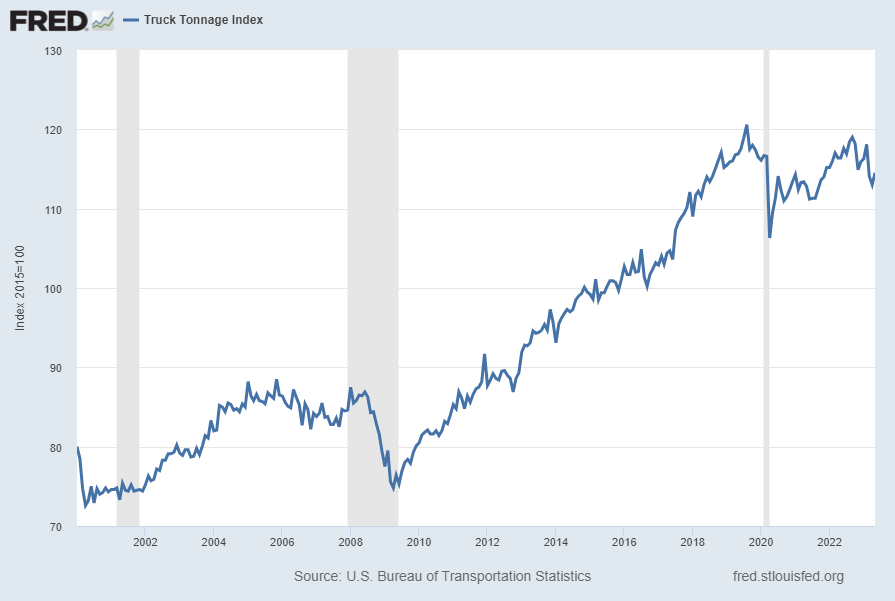
“Truck Tonnage” (TRUCKD11) has yet to reach its pre-pandemic peak, and has recently been faltering. Shown below is this measure with last value of 114.5 through May, last updated July 13, 2023:
Below is this measure displayed on a “Percent Change From Year Ago” basis with value -1.6%:
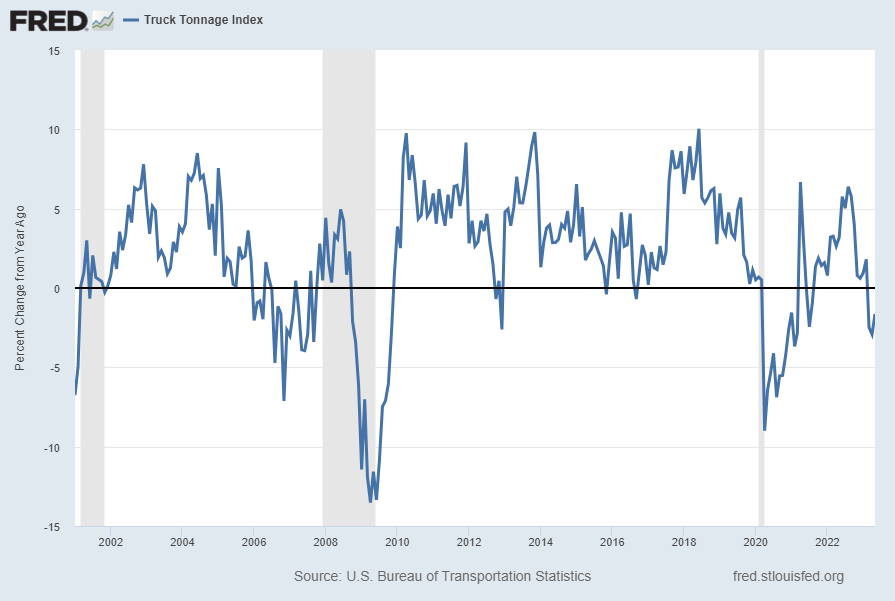
source: U.S. Bureau of Transportation Statistics, Truck Tonnage Index [TRUCKD11], retrieved from FRED, Federal Reserve Bank of St. Louis; accessed August 7, 2023: https://fred.stlouisfed.org/series/TRUCKD11
__
Total Federal Receipts (MTSR133FMS)
“Total Federal Receipts,” as measured on a “Percent Change From Year Ago” basis, has (since 2020) been volatile for various reasons. The current value, last updated July 13, 2023, is -9.6:
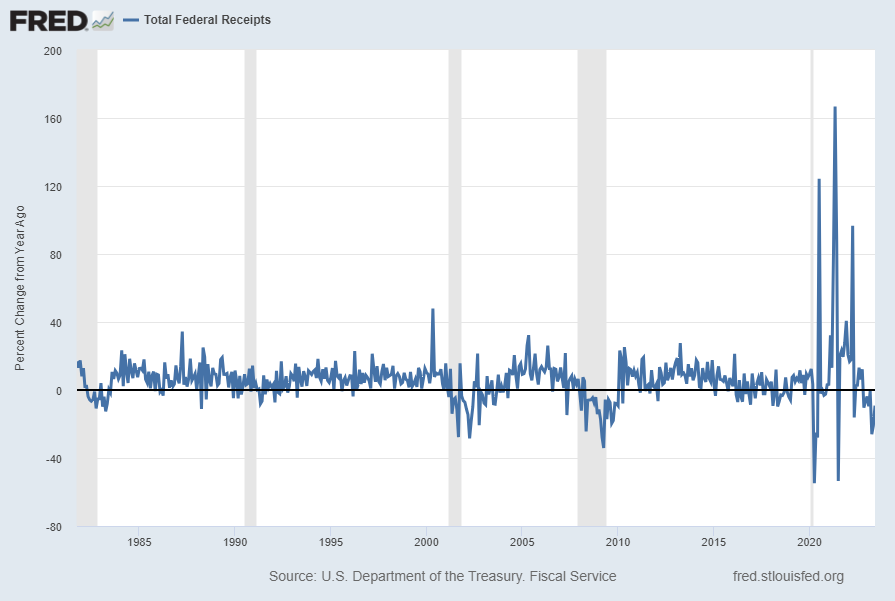
source: U.S. Department of the Treasury. Fiscal Service, Total Federal Receipts [MTSR133FMS], retrieved from FRED, Federal Reserve Bank of St. Louis; accessed August 7, 2023: https://fred.stlouisfed.org/series/MTSR133FMS
__
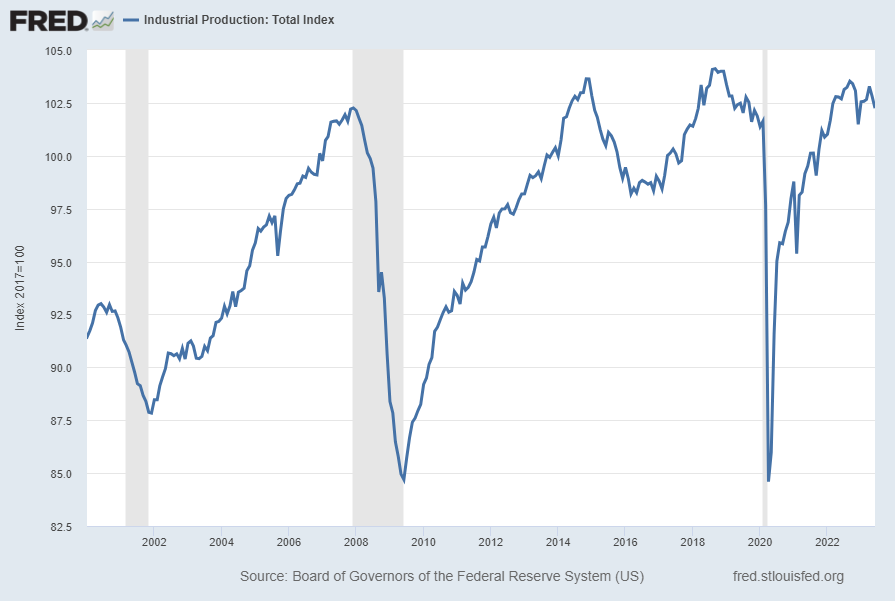
Industrial Production (INDPRO)
The “Industrial Production” measure has recently gone negative on a “Percent Change From Year Ago” basis. Shown below is a long-term chart of this measure (displayed from 2000), with last value of 102.2468 through June 2023, last updated July 18:
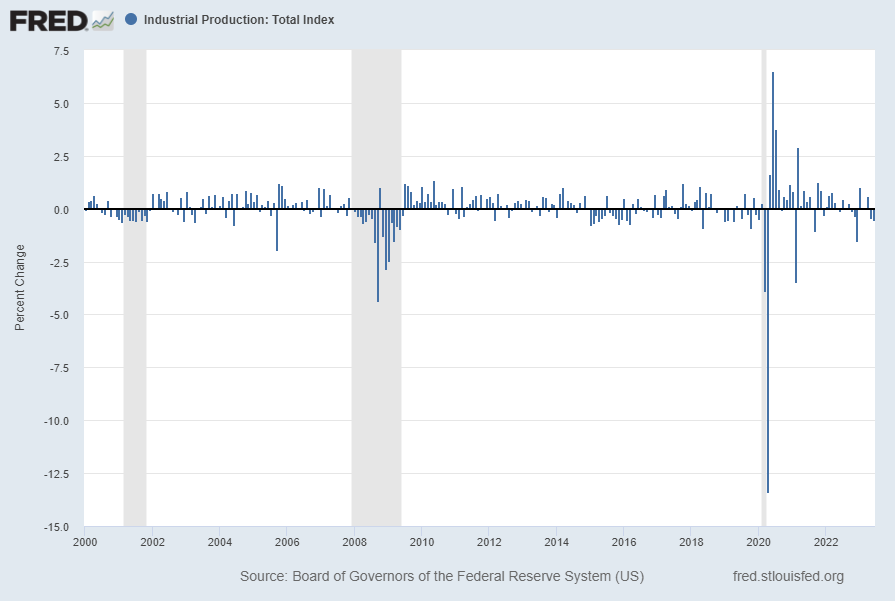
Displayed below is this INDPRO measure on a “Percent Change” basis since 2000 with last value -.5%:
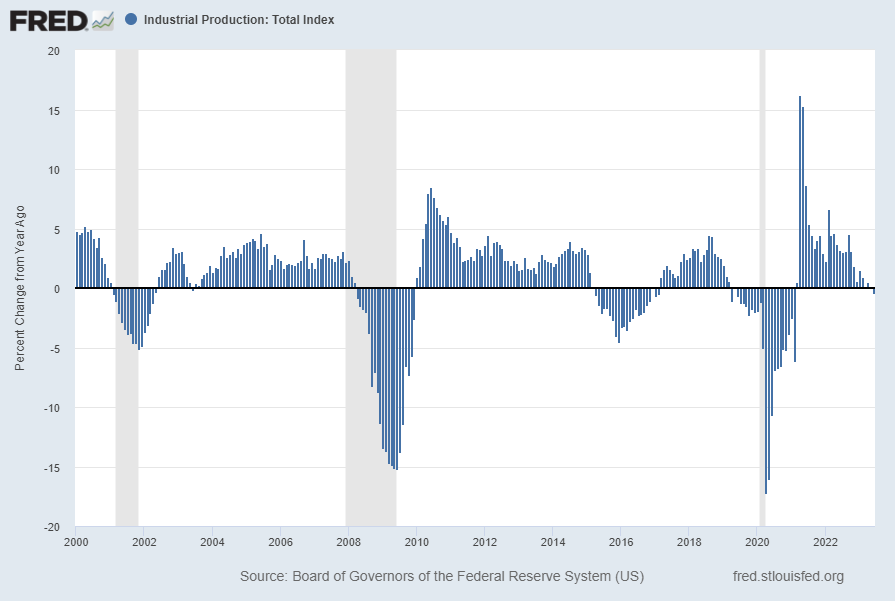
Displayed below is this INDPRO measure on a “Percent Change From Year Ago” basis since 2000 with value -0.4%:
source: Board of Governors of the Federal Reserve System (US), Industrial Production: Total Index [INDPRO], retrieved from FRED, Federal Reserve Bank of St. Louis; accessed August 7, 2023: https://fred.stlouisfed.org/series/INDPRO
__
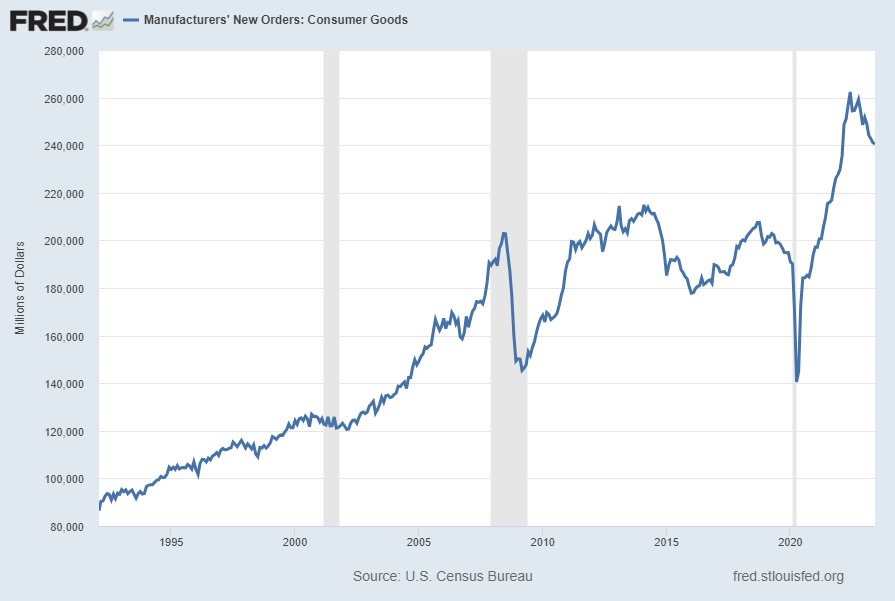
Value of Manufacturers’ New Orders for Consumer Goods Industries (ACOGNO)
A measure for consumer goods exhibiting a recent peak is the “Value of Manufacturers’ New Orders for Consumer Goods Industries” (ACOGNO). Shown below is this measure with last value of 240,537 through June 2023 (last updated August 3, 2023):
Displayed below is this same ACOGNO measure on a “Percent Change From Year Ago” basis with value -8.3:
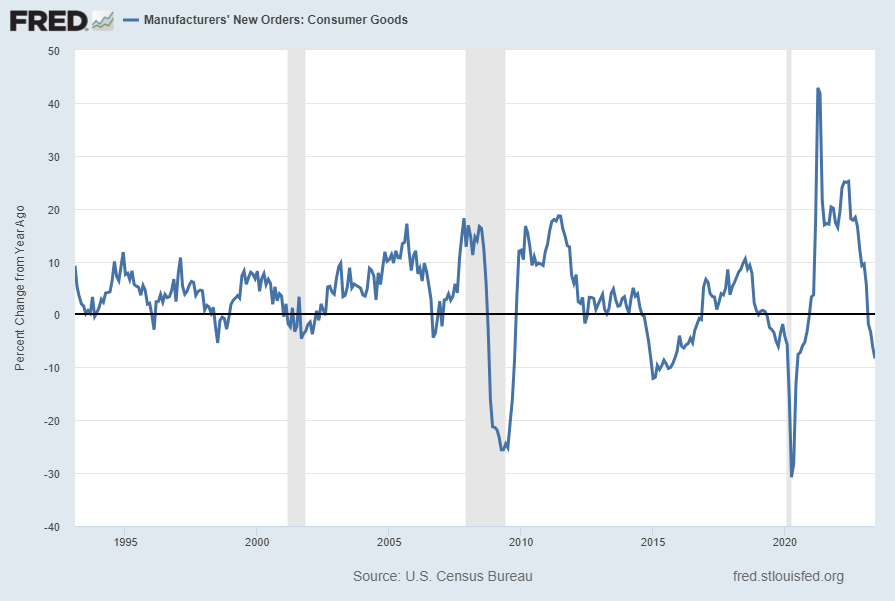
source: U.S. Census Bureau, Value of Manufacturers’ New Orders for Consumer Goods Industries [ACOGNO], retrieved from FRED, Federal Reserve Bank of St. Louis; accessed August 7, 2023: https://fred.stlouisfed.org/series/ACOGNO
__
Other Indicators
As mentioned previously, many other indicators discussed on this site indicate weak economic growth or economic contraction, if not outright (gravely) problematical economic conditions.
_____
The Special Note summarizes my overall thoughts about our economic situation
SPX at 4518.44 as this post is written