“Stock market capitalization to GDP” is a notable and important metric regarding stock market valuation. In February of 2009 I wrote of it in “Does Warren Buffett’s Market Metric Still Apply?”
On the Advisor Perspectives’ site there is an update depicting this “stock market capitalization to GDP” metric.
As seen in the May 11, 2022 post titled “Market Cap to GDP: April Buffett Valuation Indicator” two different versions are displayed, varying by the definition of stock market capitalization. (note: additional explanation is provided in the post.)
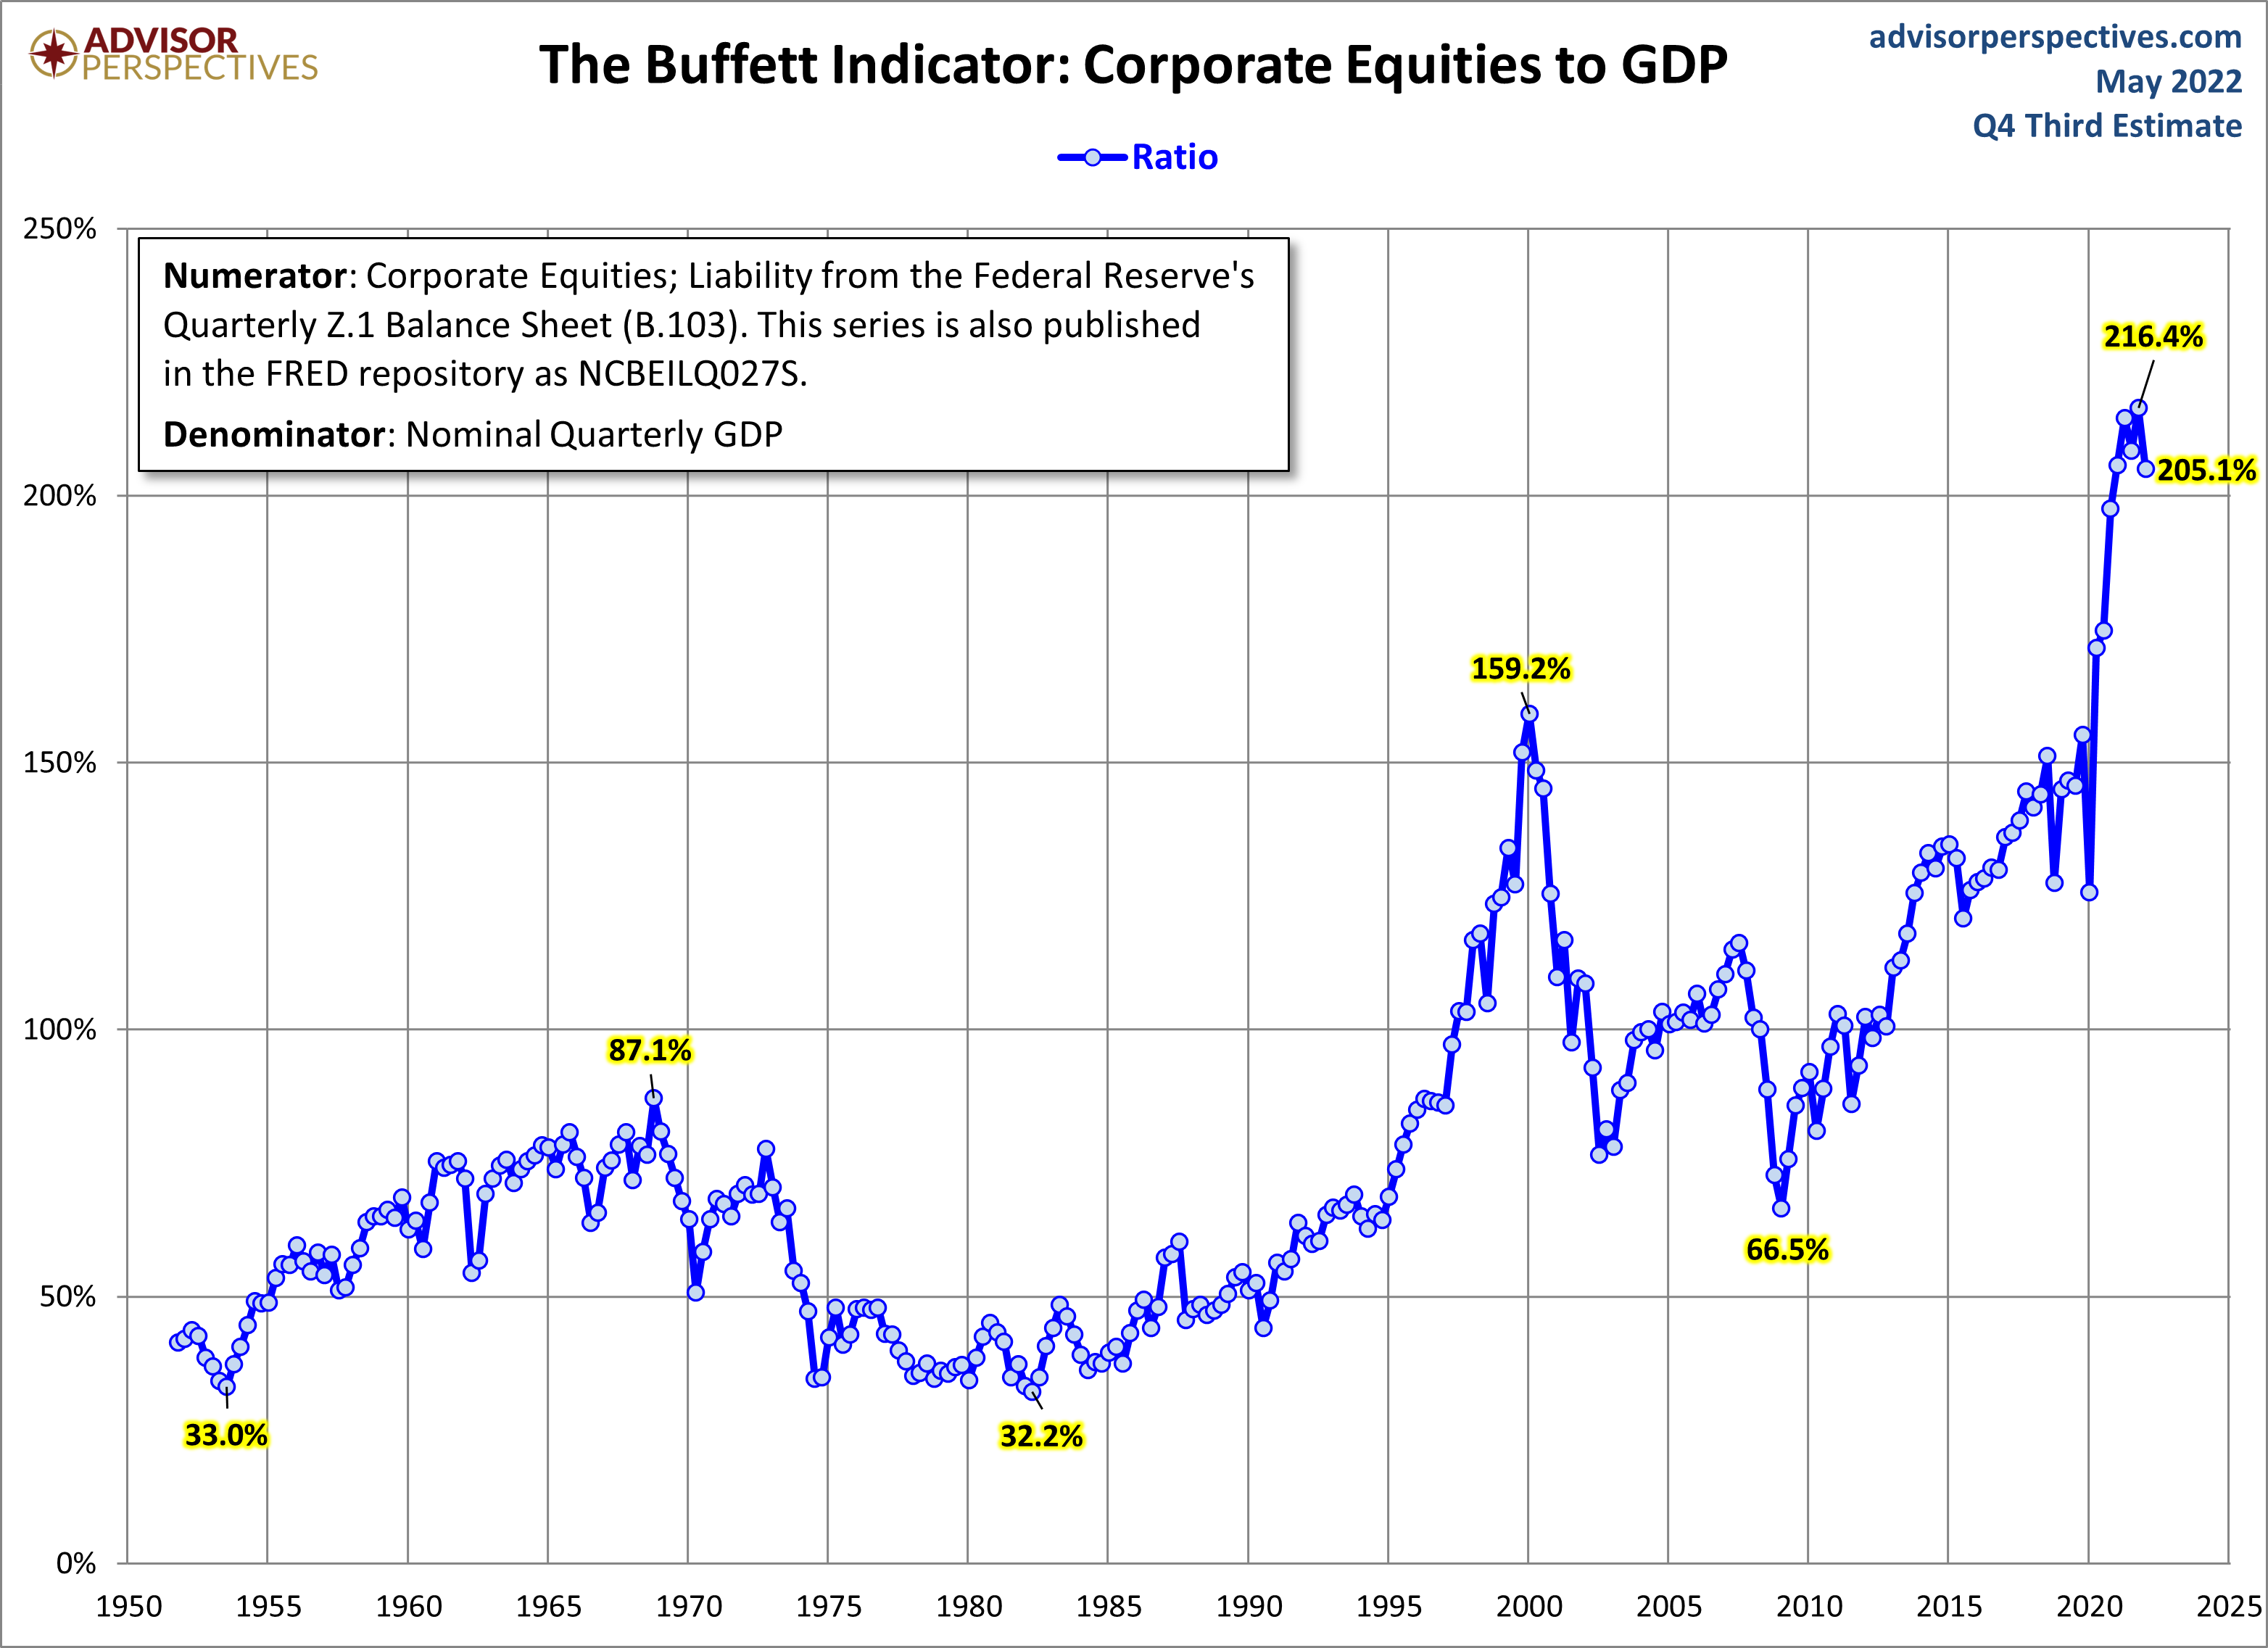
For reference purposes, here is the first chart, with the stock market capitalization as defined by the Federal Reserve:
(click on charts to enlarge images)
–
Here is the second chart, with the stock market capitalization as defined by the Wilshire 5000:
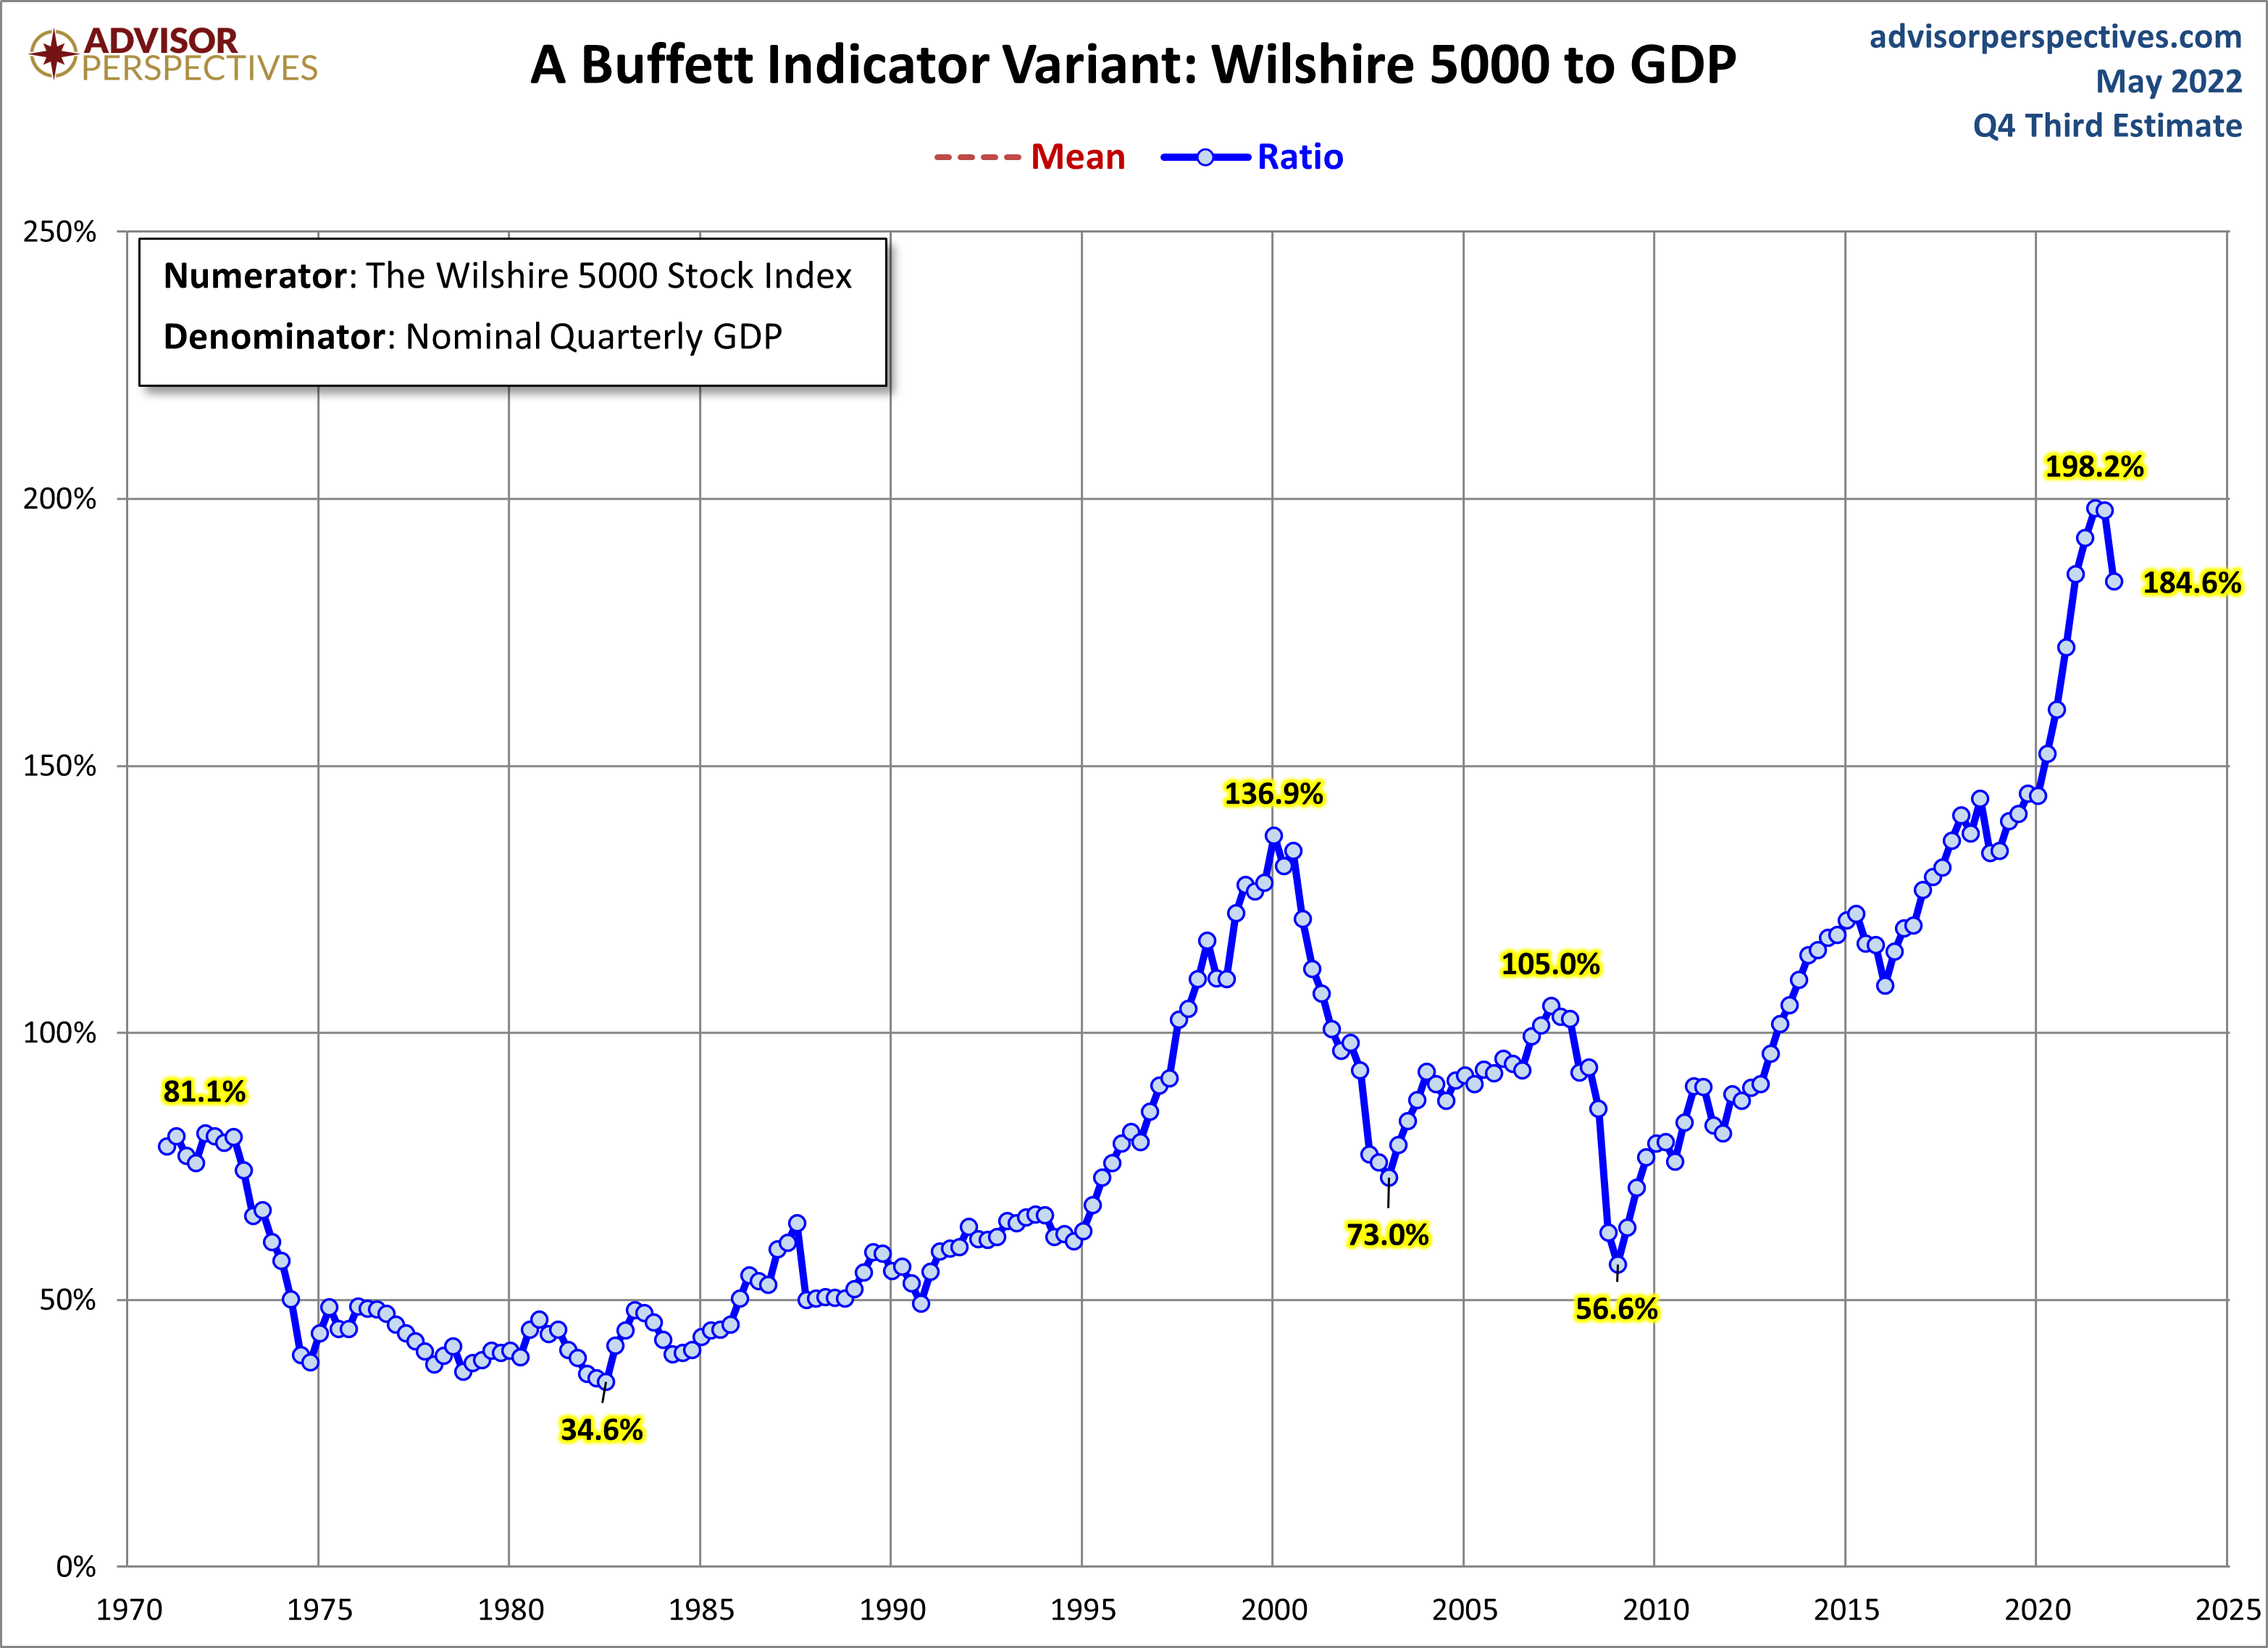
–
As one can see in both measures depicted above, “stock market capitalization to GDP” continues to be at notably high levels from a long-term historical perspective.
_____
The Special Note summarizes my overall thoughts about our economic situation
SPX at 4012.50 as this post is written