The following is an update of various indicators that are supposed to predict and/or depict economic activity. These indicators have been discussed in previous blog posts:
The December 2020 Chicago Fed National Activity Index (CFNAI) updated as of December 21, 2020:
The CFNAI, with a current reading of .27:
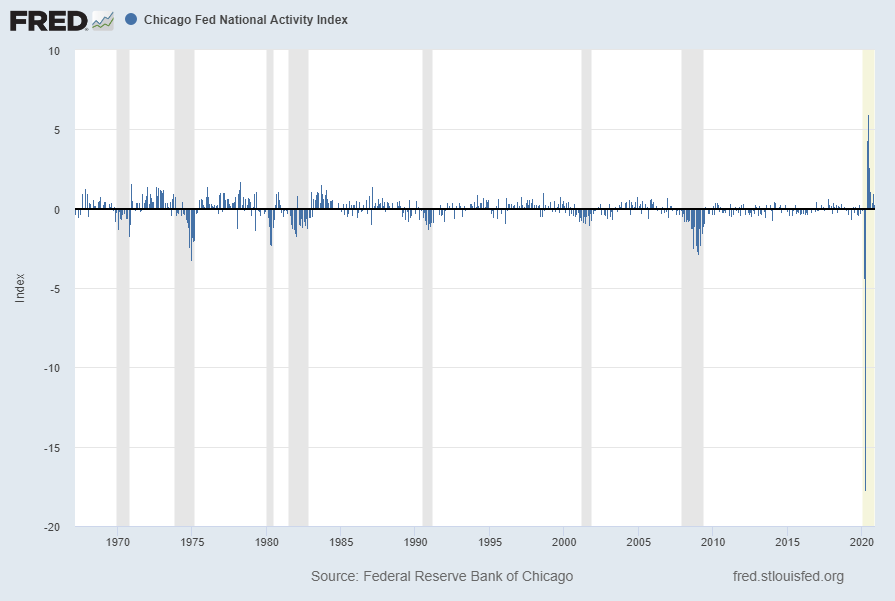
source: Federal Reserve Bank of Chicago, Chicago Fed National Activity Index [CFNAI], retrieved from FRED, Federal Reserve Bank of St. Louis, December 21, 2020;
https://fred.stlouisfed.org/series/CFNAI
The CFNAI-MA3, with a current reading of .56:
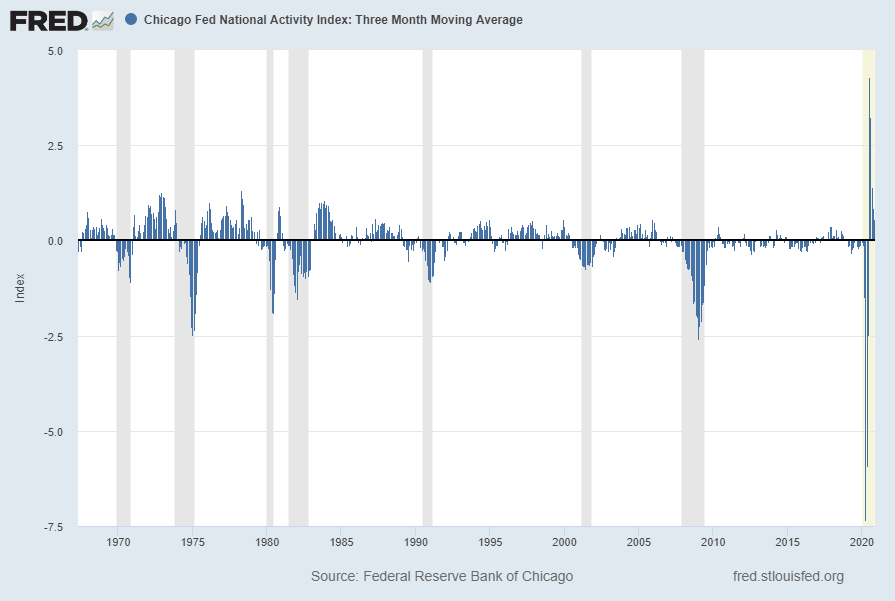
source: Federal Reserve Bank of Chicago, Chicago Fed National Activity Index: Three Month Moving Average [CFNAIMA3], retrieved from FRED, Federal Reserve Bank of St. Louis, December 21, 2020;
https://fred.stlouisfed.org/series/CFNAIMA3
–
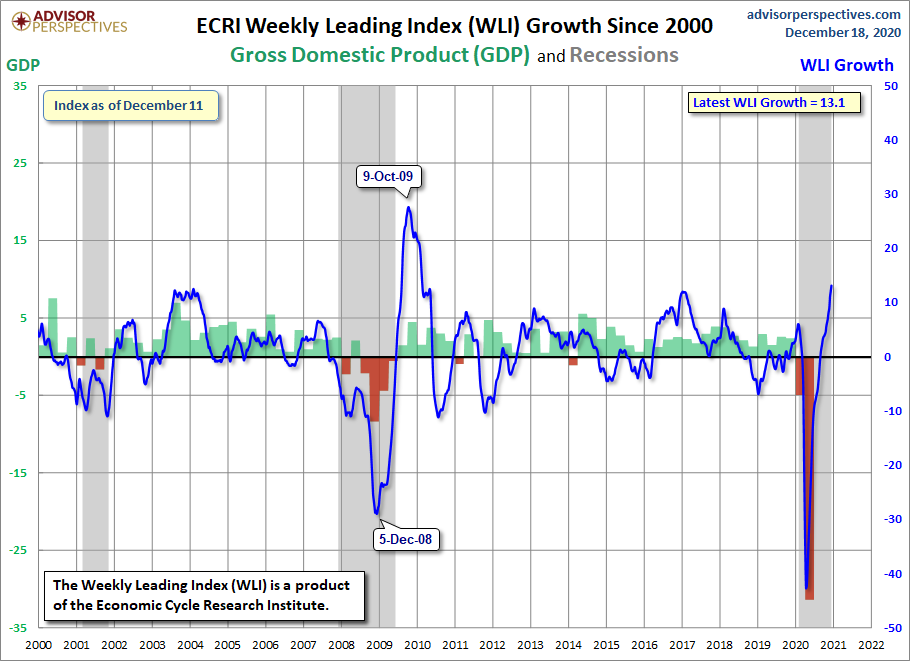
The ECRI WLI (Weekly Leading Index):
As of December 18, 2020 (incorporating data through December 11, 2020) the WLI was at 145.8 and the WLI, Gr. was at 13.1%.
A chart of the WLI,Gr., from the Advisor Perspectives’ ECRI update post of December 18, 2020:
–
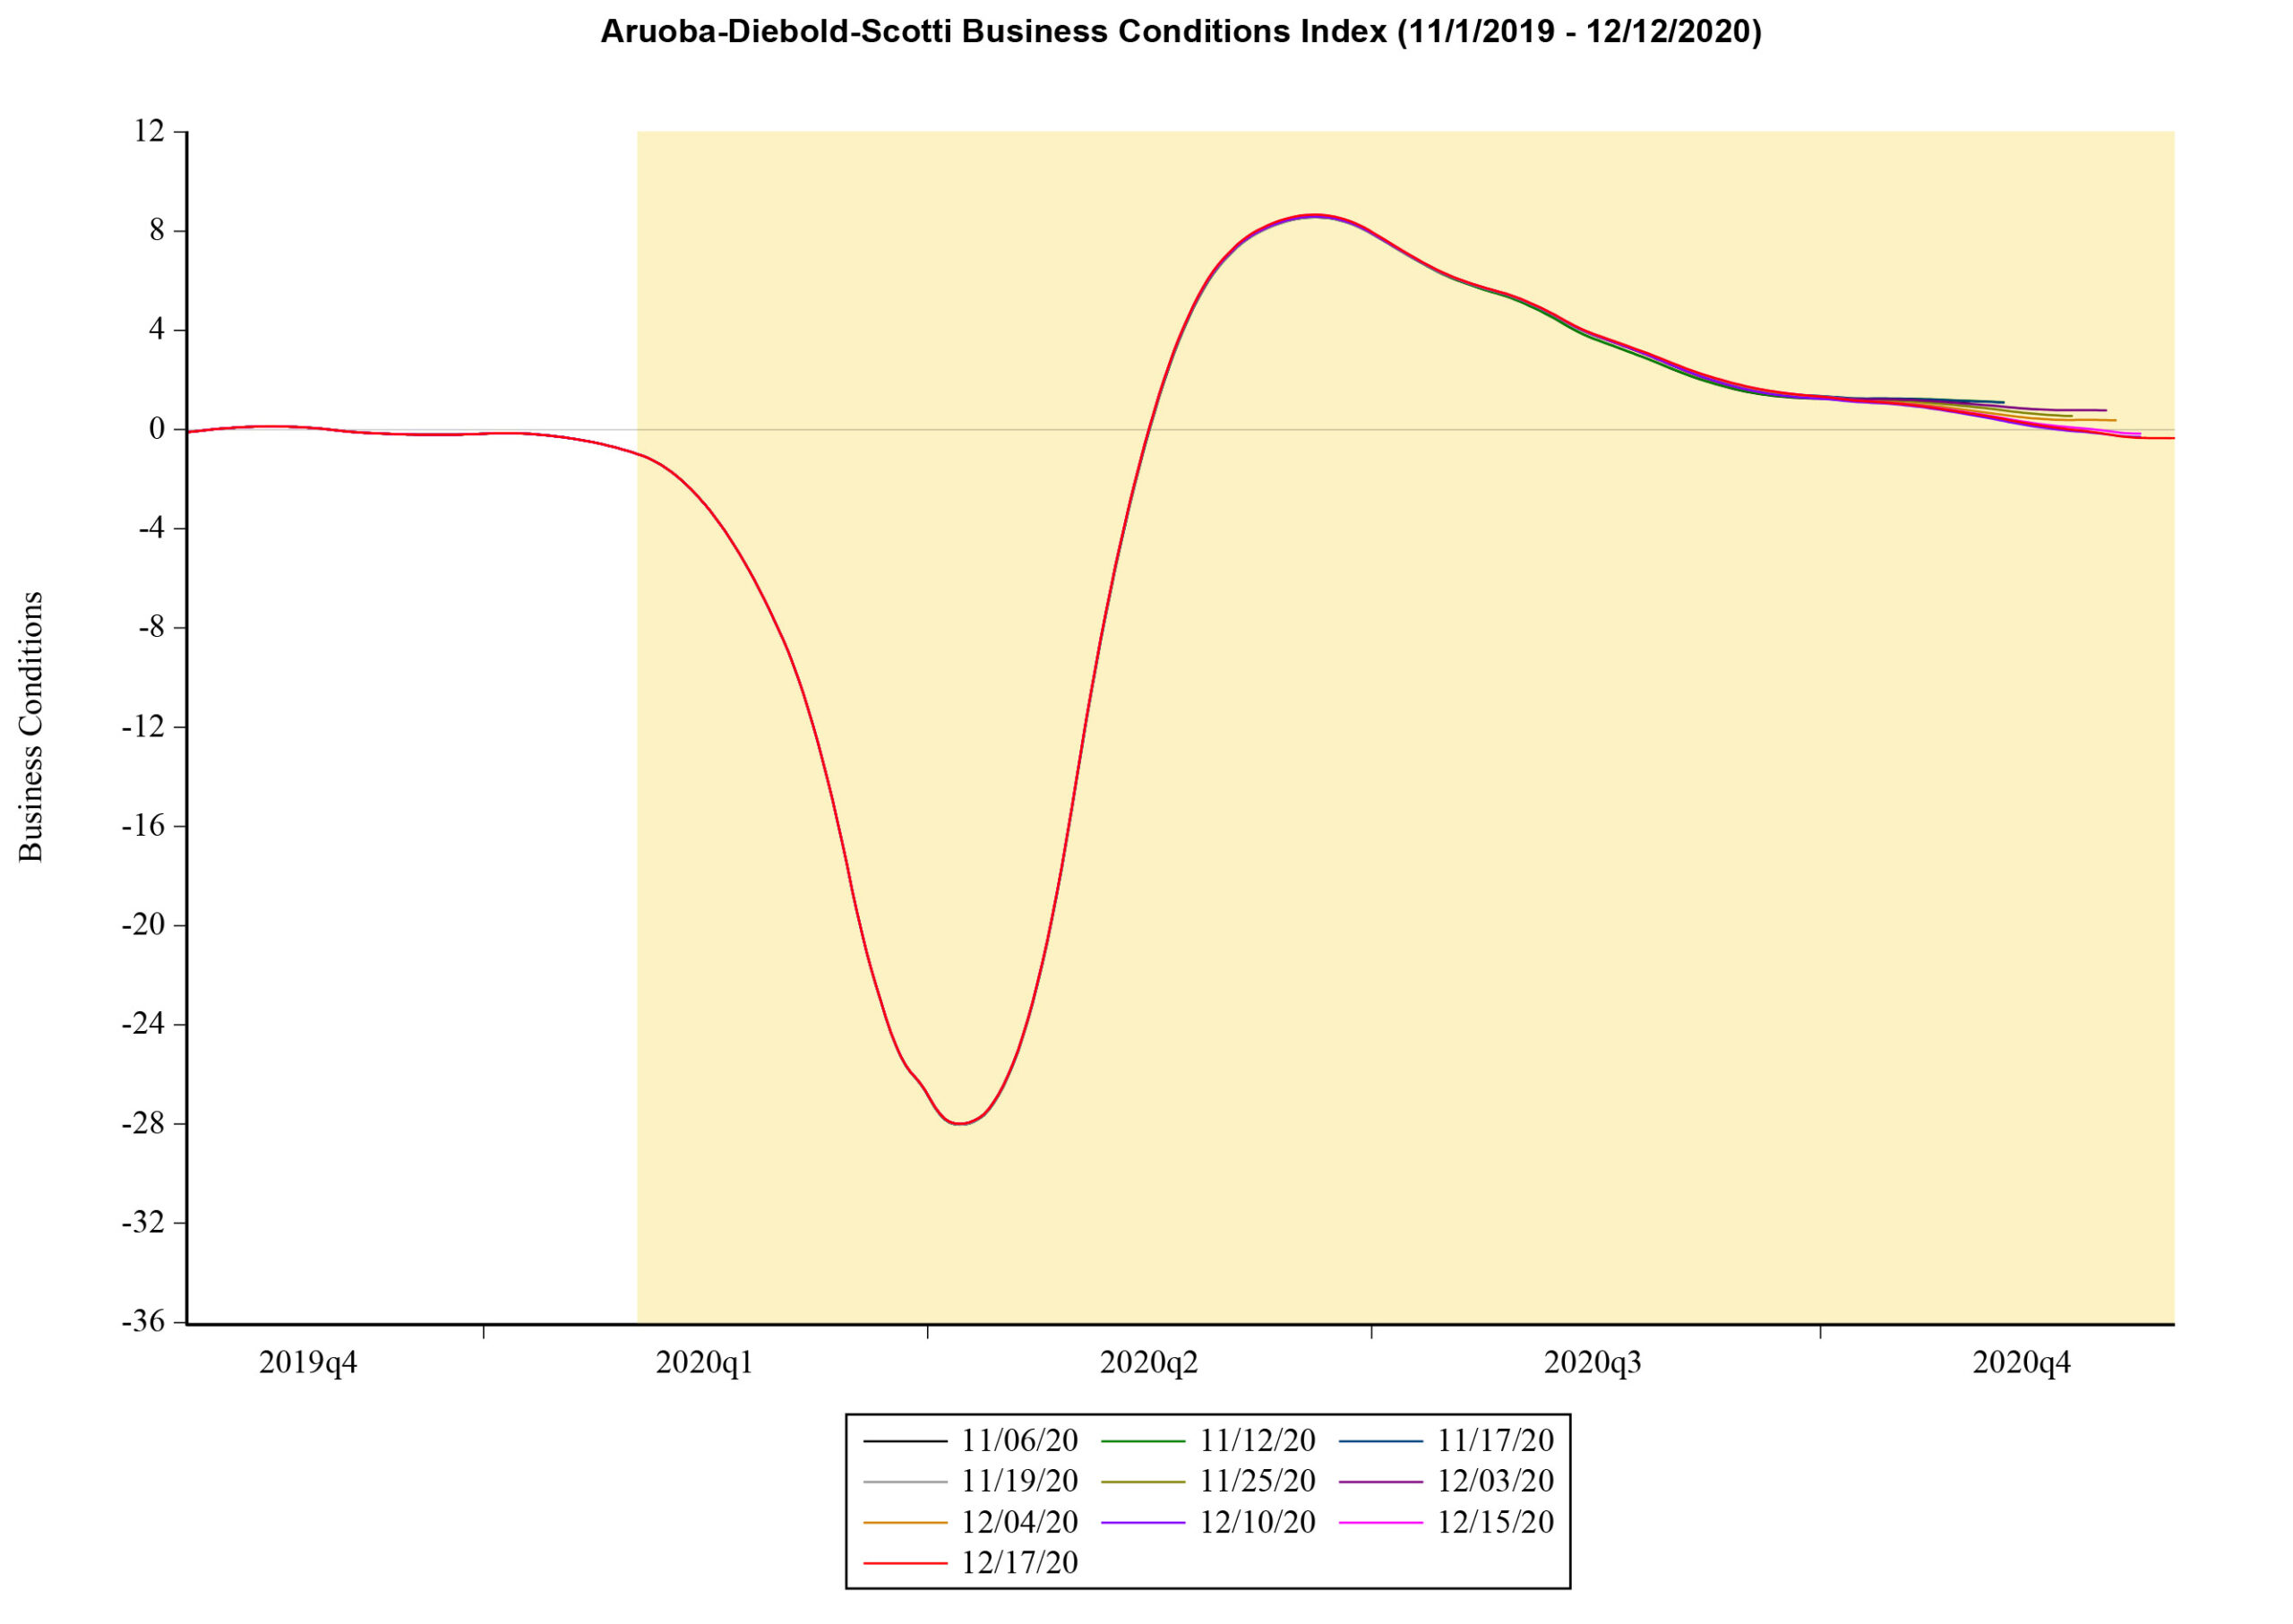
The Aruoba-Diebold-Scotti Business Conditions (ADS) Index
The ADS Index, from 11-1-2019 through 12-12-20:
–
The Conference Board Leading Economic Index (LEI), Coincident Economic Index (CEI), and Lagging Economic Index (LAG):
As per the December 18, 2020 Conference Board press release, titled “The Conference Board Leading Economic Index (LEI) for the U.S. Increased in November” the LEI was at 109.1, the CEI was at 103.2, and the LAG was 106.9 in November.
An excerpt from the release:
“The US LEI continued rising in November, but its pace of improvement has been decelerating in recent months, suggesting a significant moderation in growth as the US economy heads into 2021,” said Ataman Ozyildirim, Senior Director of Economic Research at The Conference Board. “Initial claims for unemployment insurance, new orders for manufacturing, residential construction permits, and stock prices made the largest positive contributions to the LEI. However, falling average working hours in manufacturing and consumers’ worsening outlook underscore the downside risks to growth from a second wave of COVID-19 and high unemployment.”
Here is a chart of the LEI from the Advisor Perspectives’ Conference Board Leading Economic Index update of December 18, 2020:

_________
I post various indicators and indices because I believe they should be carefully monitored. However, as those familiar with this site are aware, I do not necessarily agree with what they depict or imply.
_____
The Special Note summarizes my overall thoughts about our economic situation
SPX at 3671.25 as this post is written