The following is an update of various indicators that are supposed to predict and/or depict economic activity. These indicators have been discussed in previous blog posts:
The April 2020 Chicago Fed National Activity Index (CFNAI) updated as of April 20, 2020:
The CFNAI, with current reading of -4.19:
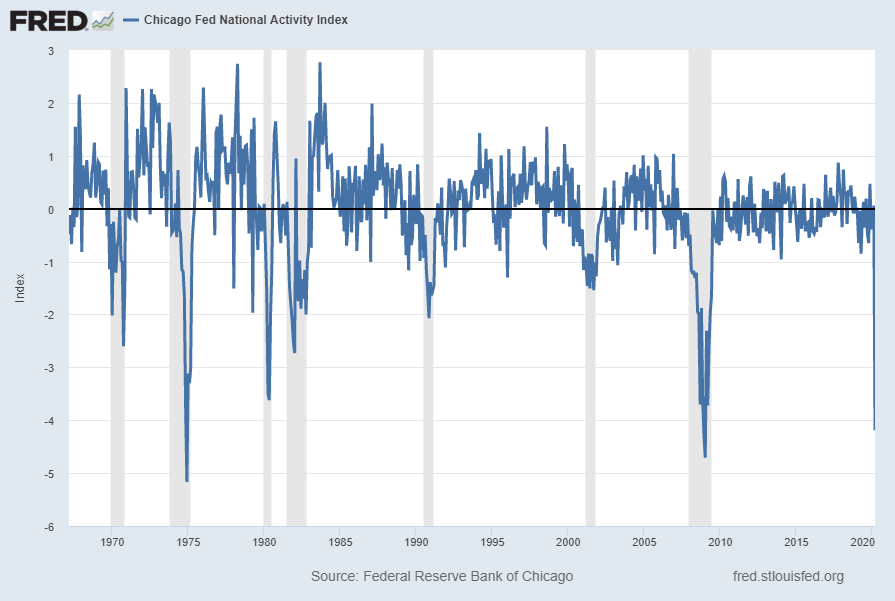
source: Federal Reserve Bank of Chicago, Chicago Fed National Activity Index [CFNAI], retrieved from FRED, Federal Reserve Bank of St. Louis, April 20, 2020;
https://fred.stlouisfed.org/series/CFNAI
The CFNAI-MA3, with current reading of -1.47:
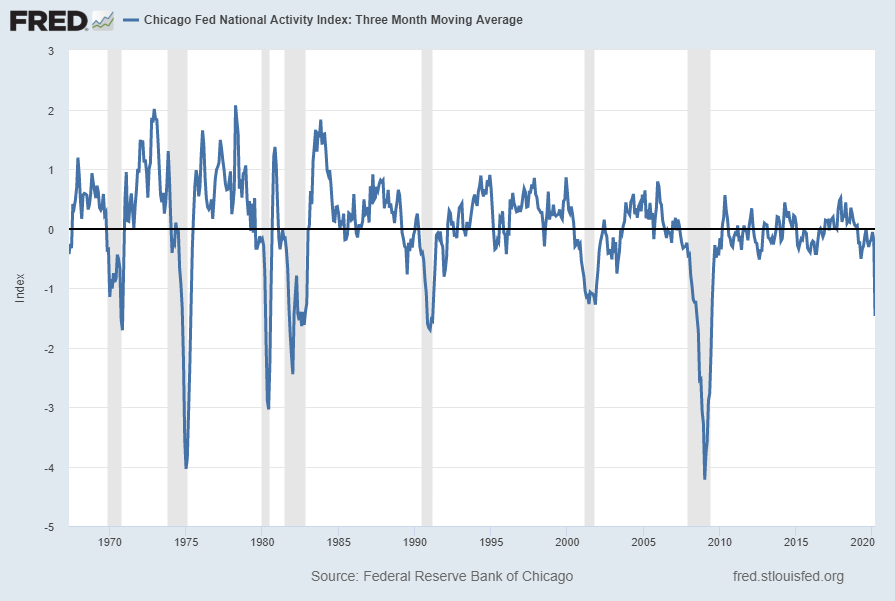
source: Federal Reserve Bank of Chicago, Chicago Fed National Activity Index: Three Month Moving Average [CFNAIMA3], retrieved from FRED, Federal Reserve Bank of St. Louis, April 20, 2020;
https://fred.stlouisfed.org/series/CFNAIMA3
–
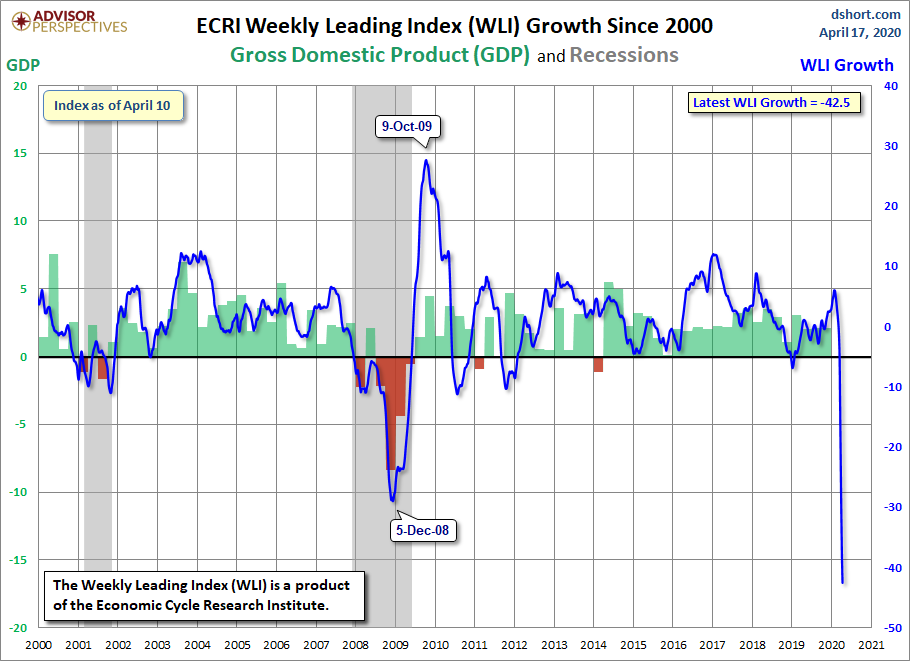
The ECRI WLI (Weekly Leading Index):
As of April 17, 2020 (incorporating data through April 10, 2020) the WLI was at 111.3 and the WLI, Gr. was at -42.5%.
A chart of the WLI,Gr., from the Advisor Perspectives’ ECRI update post of April 17, 2020:
–
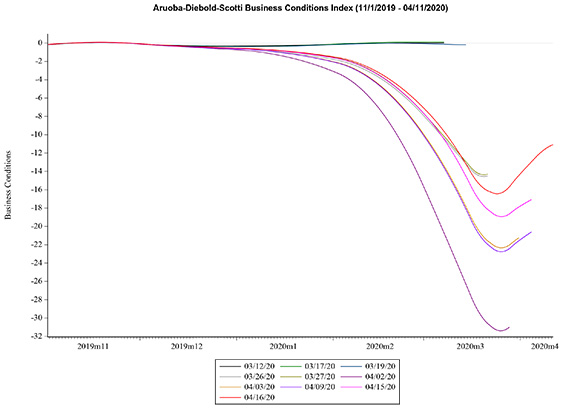
The Aruoba-Diebold-Scotti Business Conditions (ADS) Index:
Below is the latest chart, depicting the ADS Index from November 1, 2019 through April 11, 2020:
–
The Conference Board Leading (LEI), Coincident (CEI) Economic Indexes, and Lagging Economic Indicator (LAG):
As per the April 17, 2020 Conference Board press release, titled “The Conference Board Leading Economic Index (LEI) for the U.S. Plummets in March” the LEI was at 104.2, the CEI was at 106.6, and the LAG was 110.2 in March.
An excerpt from the release:
“In March, the US LEI registered the largest decline in its 60-year history,” said Ataman Ozyildirim, Senior Director of Economic Research at The Conference Board. “The unprecedented and sudden deterioration was broad based, with the largest negative contributions coming from initial claims for unemployment insurance and stock prices. The sharp drop in the LEI reflects the sudden halting in business activity as a result of the global pandemic and suggests the US economy will be facing a very deep contraction.”
Here is a chart of the LEI from the Advisor Perspectives’ Conference Board Leading Economic Index update of April 17, 2020:

_________
I post various indicators and indices because I believe they should be carefully monitored. However, as those familiar with this site are aware, I do not necessarily agree with what they depict or imply.
_____
The Special Note summarizes my overall thoughts about our economic situation
SPX at 2839.13 as this post is written