Here is an update of various indicators that are supposed to predict and/or depict economic activity. These indicators have been discussed in previous blog posts:
The June 2019 Chicago Fed National Activity Index (CFNAI) updated as of June 24, 2019:
The CFNAI, with current reading of -.05:
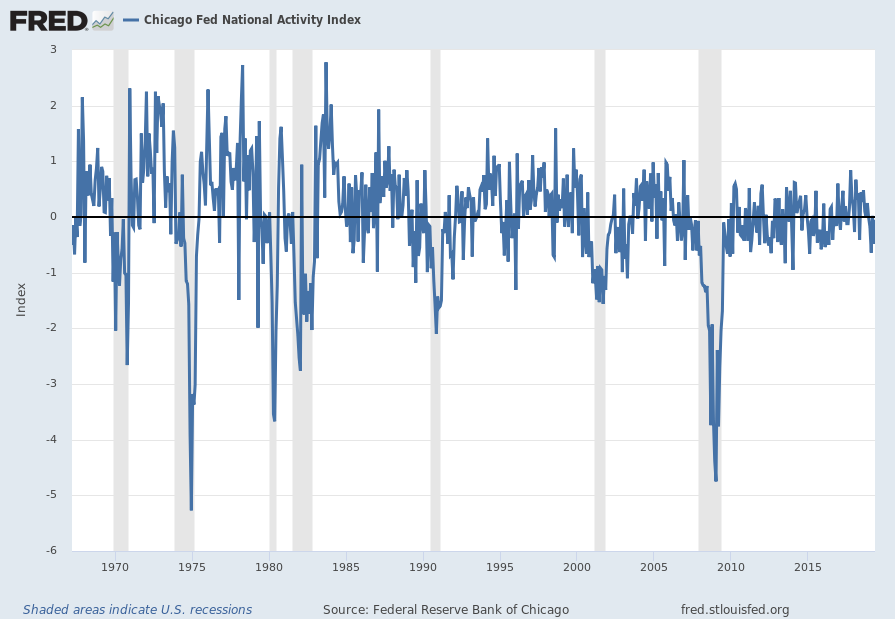
source: Federal Reserve Bank of Chicago, Chicago Fed National Activity Index [CFNAI], retrieved from FRED, Federal Reserve Bank of St. Louis, June 24, 2019;
https://fred.stlouisfed.org/series/CFNAI
The CFNAI-MA3, with current reading of -.17:
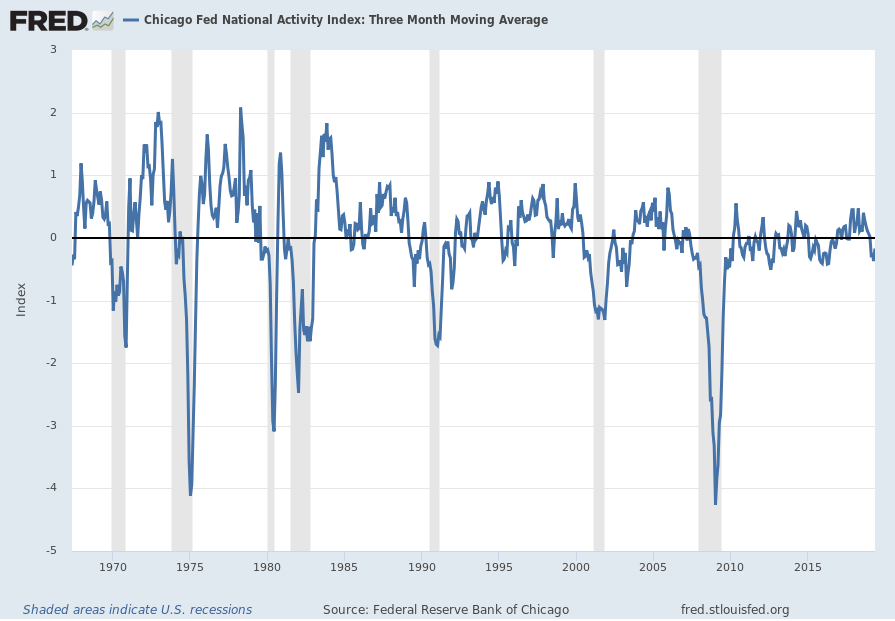
source: Federal Reserve Bank of Chicago, Chicago Fed National Activity Index: Three Month Moving Average [CFNAIMA3], retrieved from FRED, Federal Reserve Bank of St. Louis, June 24, 2019;
https://fred.stlouisfed.org/series/CFNAIMA3
–
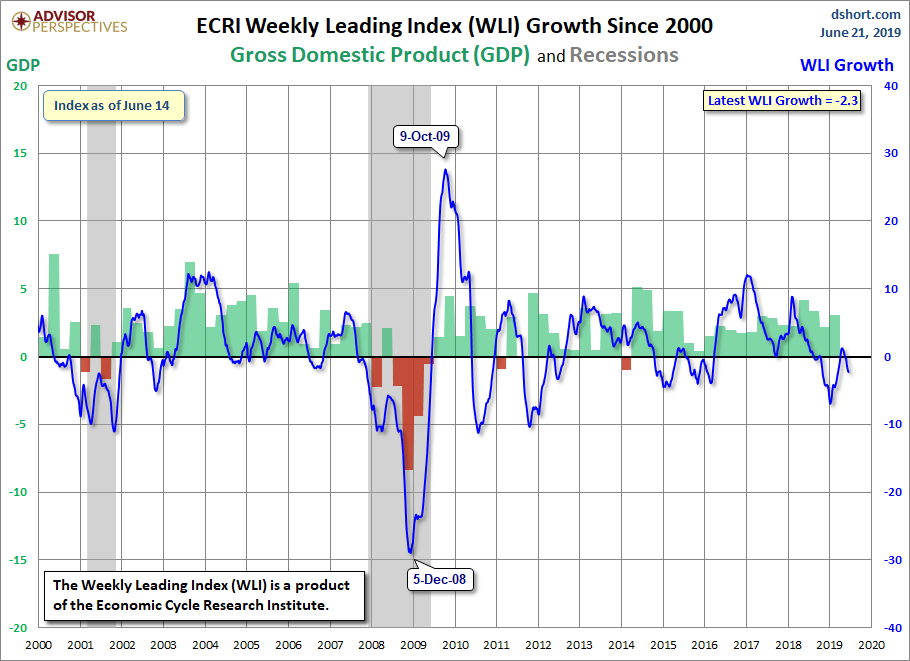
The ECRI WLI (Weekly Leading Index):
As of June 21, 2019 (incorporating data through June 14, 2019) the WLI was at 144.6 and the WLI, Gr. was at -2.3%.
A chart of the WLI,Gr., from the Doug Short’s site ECRI update post of June 21, 2019:
–
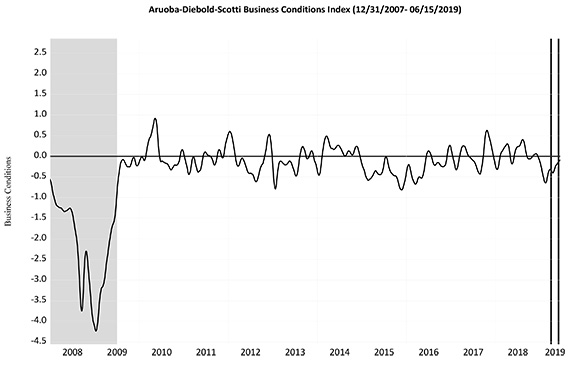
The Aruoba-Diebold-Scotti Business Conditions (ADS) Index:
Here is the latest chart, depicting the ADS Index from December 31, 2007 through June 15, 2019:
–
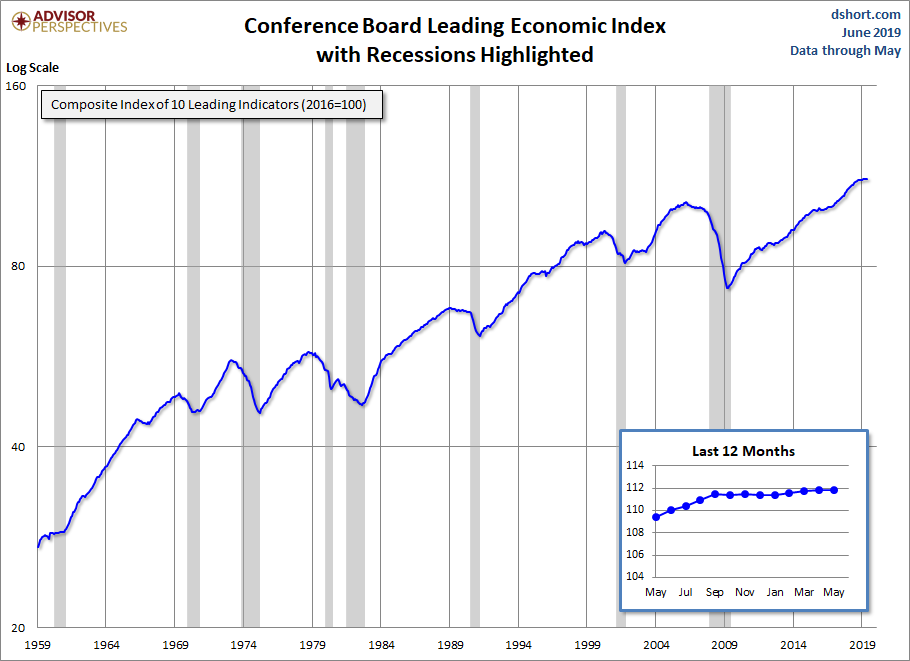
The Conference Board Leading (LEI), Coincident (CEI) Economic Indexes, and Lagging Economic Indicator (LAG):
As per the June 20, 2019 press release, titled “The Conference Board Leading Economic Index (LEI) for the U.S. Remained Unchanged in May” (pdf) the LEI was at 111.8, the CEI was at 105.9, and the LAG was 107.0 in May.
An excerpt from the release:
“The US LEI was unchanged in May, following three consecutive increases,” said Ataman Ozyildirim, Director of Economic Research at The Conference Board. “Positive contributions from financial conditions and consumers’ outlook offset the weakness in stock prices and the manufacturing sector. The yield spread’s contribution to the LEI was neither positive nor negative. While the economic expansion is now entering its eleventh year, the longest in US history, the LEI clearly points to a moderation in growth towards 2 percent by year end.”
Here is a chart of the LEI from the Doug Short’s site Conference Board Leading Economic Index update of June 20, 2019:
_________
I post various indicators and indices because I believe they should be carefully monitored. However, as those familiar with this site are aware, I do not necessarily agree with what they depict or imply.
_____
The Special Note summarizes my overall thoughts about our economic situation
SPX at 2953.25 as this post is written