My overall analysis indicates a continuing elevated and growing level of financial danger which contains many worldwide and U.S.-specific “stresses” of a very complex nature. I have written numerous posts in this site concerning both ongoing and recent “negative developments.” These developments, as well as other exceedingly problematic conditions, have presented a highly perilous economic environment that endangers the overall financial system.
Also of ongoing immense importance is the existence of various immensely large asset bubbles, a subject of which I have extensively written. While all of these asset bubbles are wildly pernicious and will have profound adverse future implications, hazards presented by the bond market bubble are especially notable.
Predicting the specific timing and extent of a stock market crash is always difficult, and the immense complexity of today’s economic situation makes such a prediction even more challenging. With that being said, my analyses continue to indicate that a near-term exceedingly large (from an ultra-long term perspective) stock market crash – that would also involve (as seen in 2008) various other markets as well – will occur.
(note: the “next crash” and its aftermath has great significance and implications, as discussed in the post of January 6, 2012 titled “The Next Crash And Its Significance“ and various subsequent posts in the “Economic Depression” category)
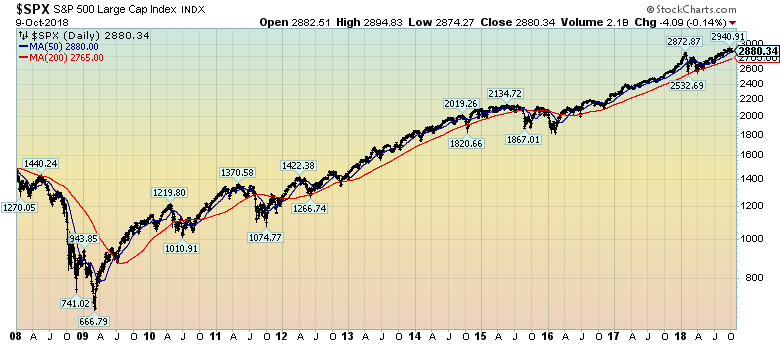
As reference, below is a daily chart since 2008 of the S&P500 (through October 9, 2018 with a last price of 2880.34), depicted on a LOG scale, indicating both the 50dma and 200dma as well as price labels:
(click on chart to enlarge image)(chart courtesy of StockCharts.com; chart creation and annotation by the author)
_____
The Special Note summarizes my overall thoughts about our economic situation
SPX at 2880.35 as this post is written