Here is an update of various indicators that are supposed to predict and/or depict economic activity. These indicators have been discussed in previous blog posts:
The August 2018 Chicago Fed National Activity Index (CFNAI) updated as of August 27, 2018:
The CFNAI, with current reading of .13:
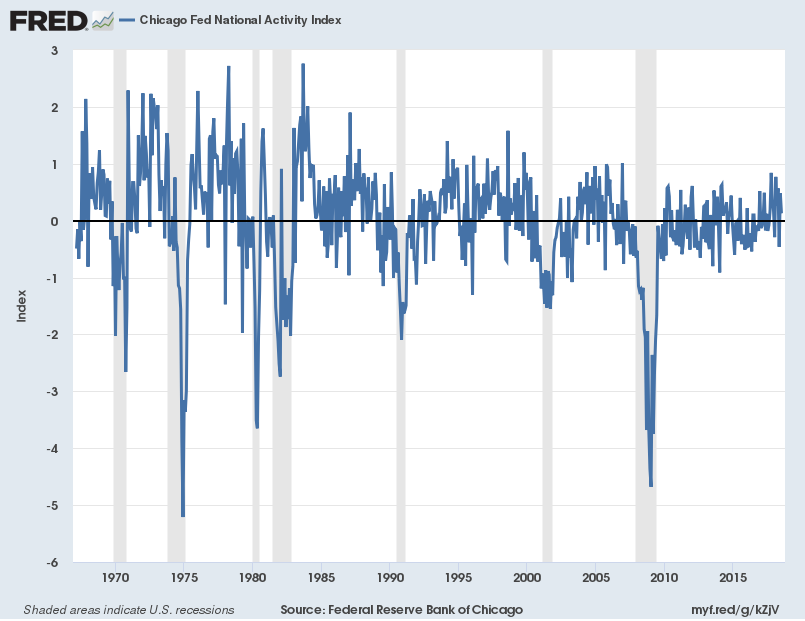
source: Federal Reserve Bank of Chicago, Chicago Fed National Activity Index [CFNAI], retrieved from FRED, Federal Reserve Bank of St. Louis, August 27, 2018;
https://fred.stlouisfed.org/series/CFNAI
The CFNAI-MA3, with current reading of .05:
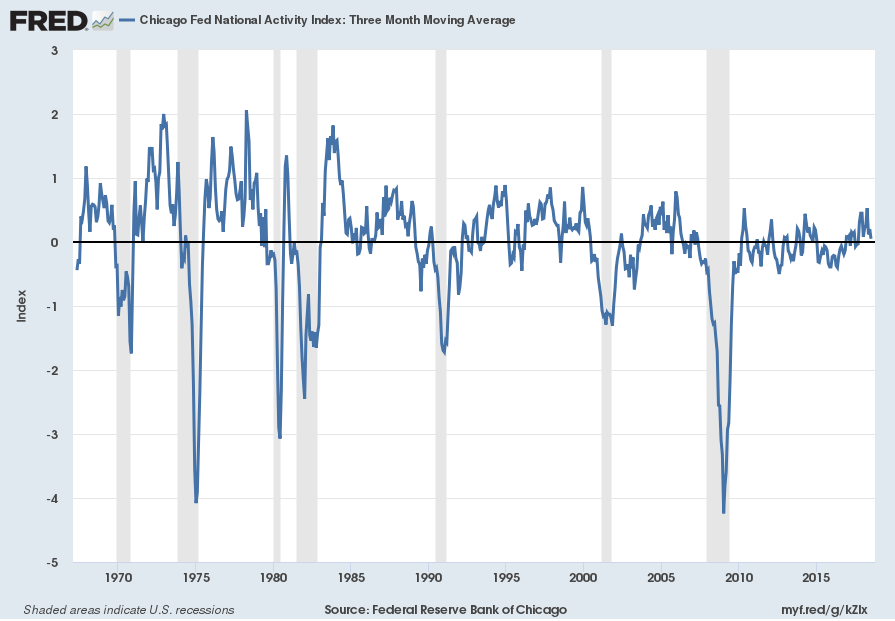
source: Federal Reserve Bank of Chicago, Chicago Fed National Activity Index: Three Month Moving Average [CFNAIMA3], retrieved from FRED, Federal Reserve Bank of St. Louis, August 27, 2018;
https://fred.stlouisfed.org/series/CFNAIMA3
–
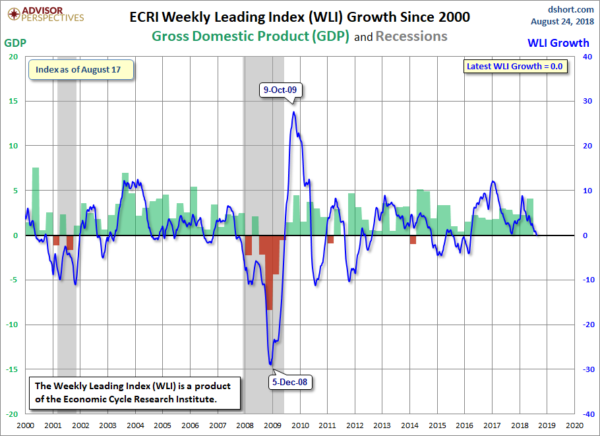
The ECRI WLI (Weekly Leading Index):
As of August 24, 2018 (incorporating data through August 17, 2018) the WLI was at 147.3 and the WLI, Gr. was at 0%.
A chart of the WLI,Gr., from the Doug Short’s site ECRI update post of August 24, 2018:
–
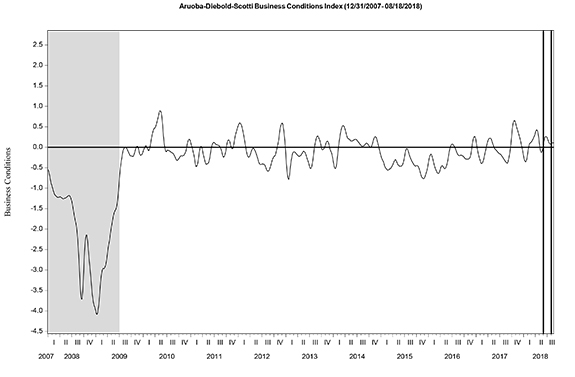
The Aruoba-Diebold-Scotti Business Conditions (ADS) Index:
Here is the latest chart, depicting the ADS Index from December 31, 2007 through August 18, 2018:
–
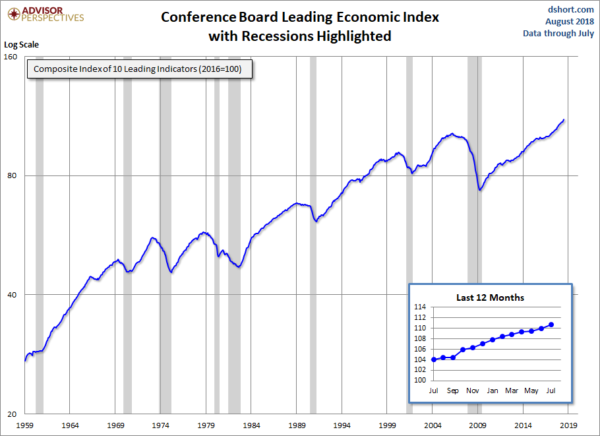
The Conference Board Leading (LEI), Coincident (CEI) Economic Indexes, and Lagging Economic Indicator (LAG):
As per the August 17, 2018 press release, titled “The Conference Board Leading Economic Index (LEI) for the U.S. Increased in July” (pdf) the LEI was at 110.7, the CEI was at 104.2, and the LAG was 105.2 in July.
An excerpt from the release:
“The U.S. LEI increased in July, suggesting the US economy will continue expanding at a solid pace for the remainder of this year,” said Ataman Ozyildirim, Director of Business Cycles and Growth Research at The Conference Board. “The strengths among the components of the leading index were very widespread, with unemployment claims, the financial components, and the ISM® New Orders Index making the largest positive contributions.”
Here is a chart of the LEI from the Doug Short’s site Conference Board Leading Economic Index update of August 17, 2018:
_________
I post various indicators and indices because I believe they should be carefully monitored. However, as those familiar with this site are aware, I do not necessarily agree with what they depict or imply.
_____
The Special Note summarizes my overall thoughts about our economic situation
SPX at 2895.73 as this post is written