Here is an update of various indicators that are supposed to predict and/or depict economic activity. These indicators have been discussed in previous blog posts:
The January 2018 Chicago Fed National Activity Index (CFNAI) updated as of January 22, 2018:
The CFNAI, with current reading of .27:
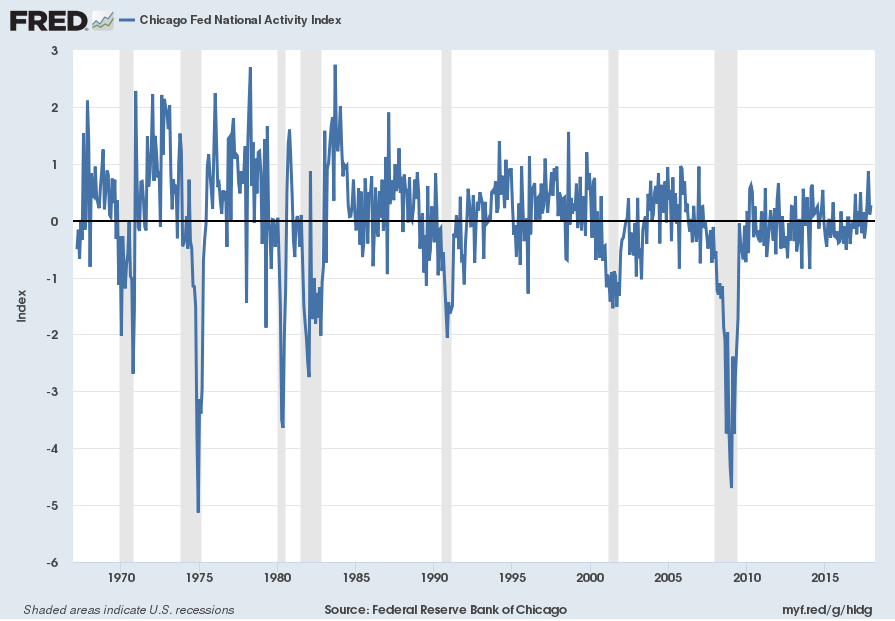
Federal Reserve Bank of Chicago, Chicago Fed National Activity Index [CFNAI], retrieved from FRED, Federal Reserve Bank of St. Louis, January 22, 2018;
https://fred.stlouisfed.org/series/CFNAI
The CFNAI-MA3, with current reading of .42:
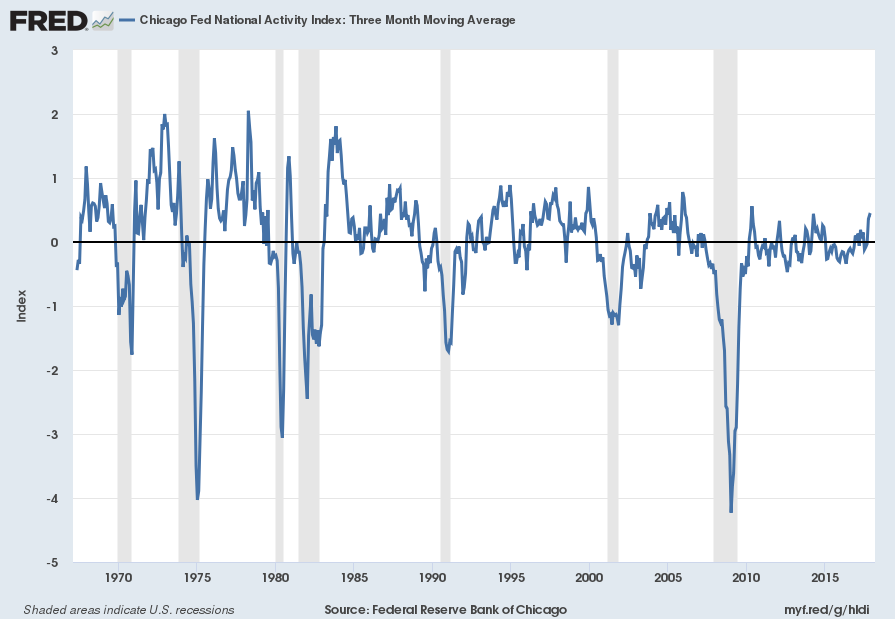
Federal Reserve Bank of Chicago, Chicago Fed National Activity Index: Three Month Moving Average [CFNAIMA3], retrieved from FRED, Federal Reserve Bank of St. Louis, January 22, 2018;
https://fred.stlouisfed.org/series/CFNAIMA3
–
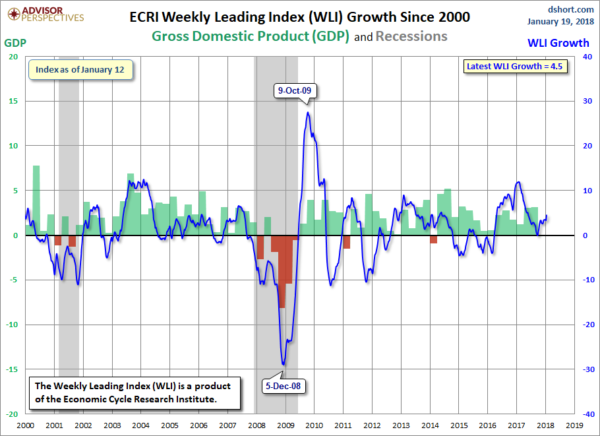
The ECRI WLI (Weekly Leading Index):
As of January 19, 2018 (incorporating data through January 12, 2018) the WLI was at 150.3 and the WLI, Gr. was at 4.5%.
A chart of the WLI,Gr., from Doug Short’s ECRI update post of January 19, 2018:
–
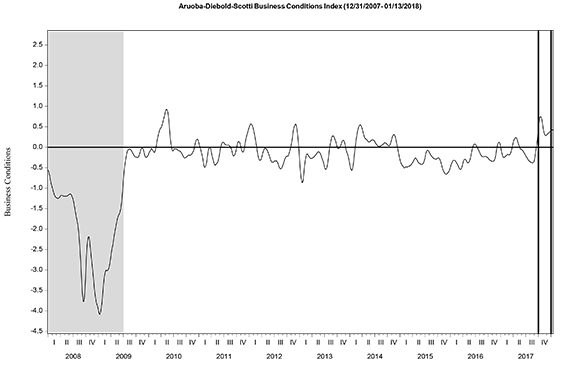
The Aruoba-Diebold-Scotti Business Conditions (ADS) Index:
Here is the latest chart, depicting the ADS Index from December 31, 2007 through January13, 2018:
–
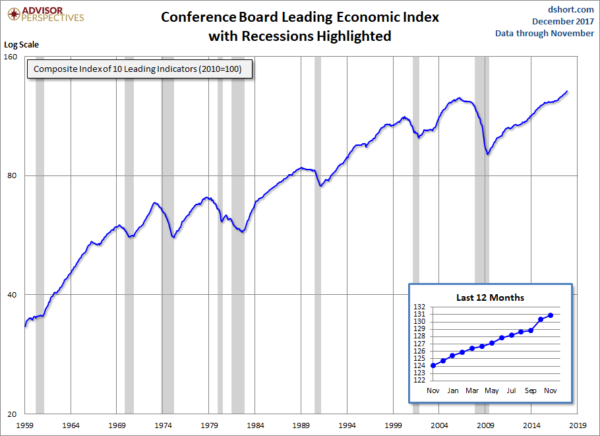
The Conference Board Leading (LEI), Coincident (CEI) Economic Indexes, and Lagging Economic Indicator (LAG):
As per the December 21, 2017 press release, titled “The Conference Board Leading Economic Index (LEI) for the U.S. Increased Again” (pdf) the LEI was at 130.9, the CEI was at 116.5, and the LAG was 125.6 in November.
An excerpt from the release:
“The U.S. LEI rose again in November, suggesting that solid economic growth will continue into the first half of 2018,” said Ataman Ozyildirim, Director of Business Cycles and Growth Research at The Conference Board. “In recent months, unemployment insurance claims have returned to pre-hurricane levels. In addition, improving financial indicators, new orders in manufacturing and historically high consumer sentiment have propelled the U.S. LEI even higher.”
Here is a chart of the LEI from Doug Short’s Conference Board Leading Economic Index update of December 21, 2017:
_________
I post various indicators and indices because I believe they should be carefully monitored. However, as those familiar with this site are aware, I do not necessarily agree with what they depict or imply.
_____
The Special Note summarizes my overall thoughts about our economic situation
SPX at 2832.97 as this post is written