Here is an update of various indicators that are supposed to predict and/or depict economic activity. These indicators have been discussed in previous blog posts:
The May 2017 Chicago Fed National Activity Index (CFNAI) updated as of May 22, 2017:
The CFNAI, with current reading of .49:
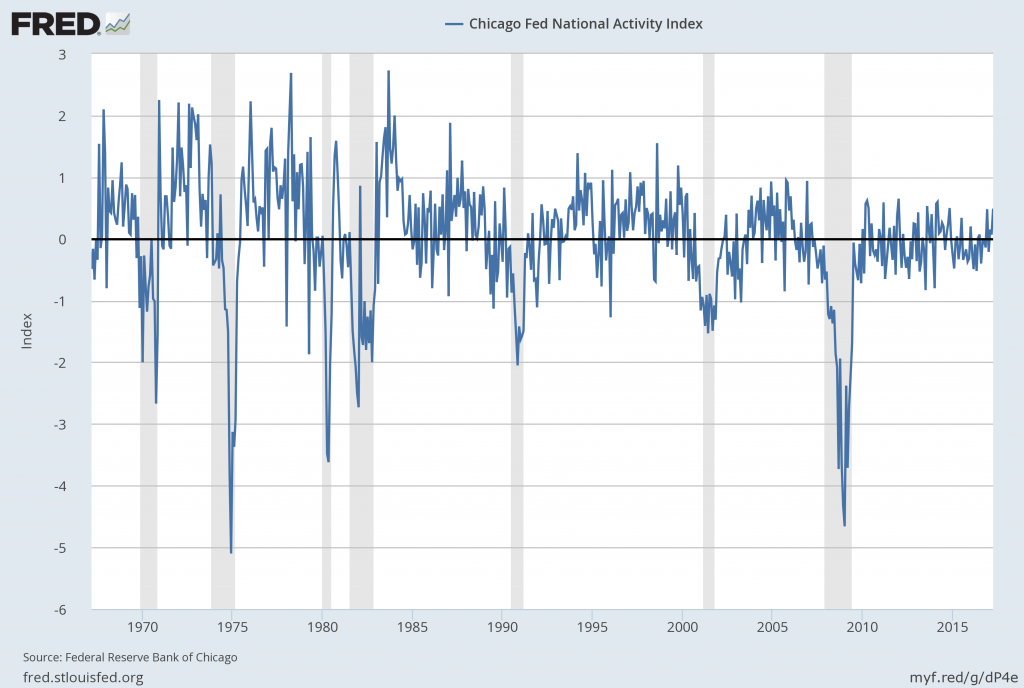
Federal Reserve Bank of Chicago, Chicago Fed National Activity Index [CFNAI], retrieved from FRED, Federal Reserve Bank of St. Louis, May 22, 2017;
https://fred.stlouisfed.org/series/CFNAI
The CFNAI-MA3, with current reading of .23:
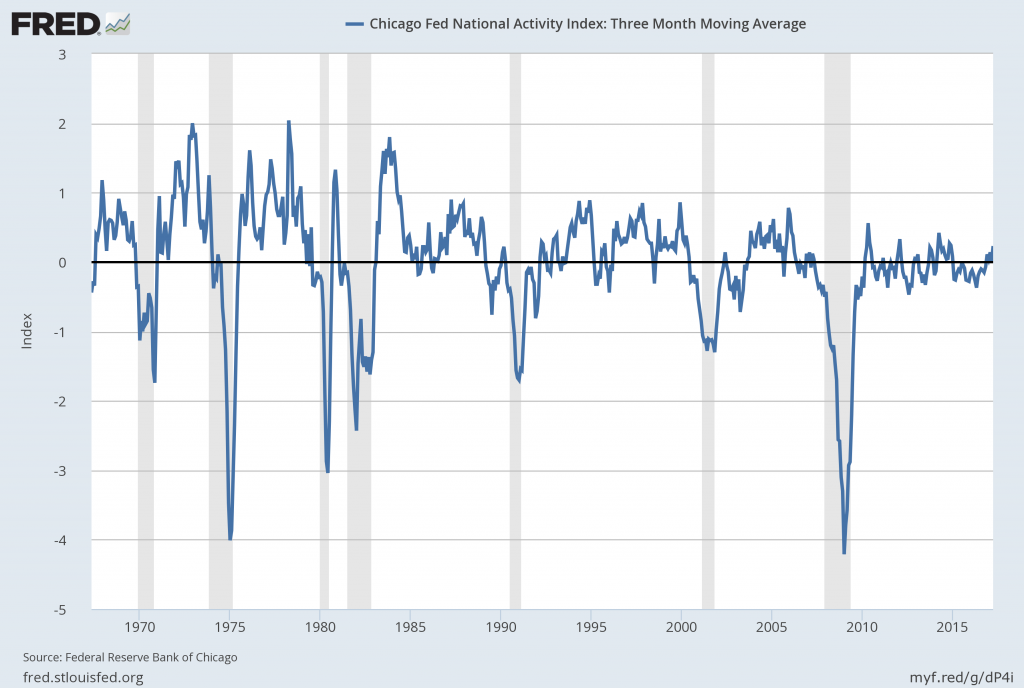
Federal Reserve Bank of Chicago, Chicago Fed National Activity Index: Three Month Moving Average [CFNAIMA3], retrieved from FRED, Federal Reserve Bank of St. Louis, May 22, 2017;
https://fred.stlouisfed.org/series/CFNAIMA3
–
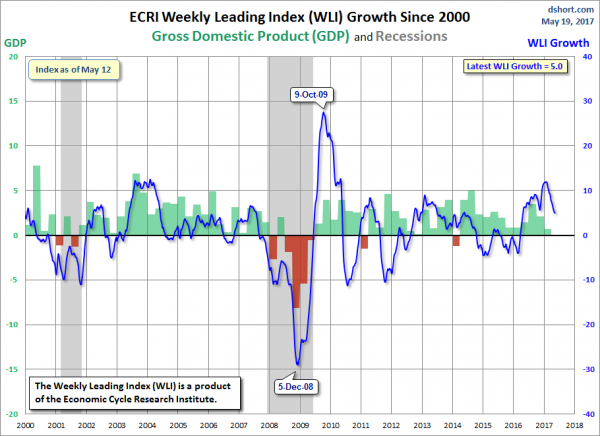
The ECRI WLI (Weekly Leading Index):
As of May 19, 2017 (incorporating data through May 12, 2017) the WLI was at 144.5 and the WLI, Gr. was at 5.0%.
A chart of the WLI,Gr., from Doug Short’s ECRI update post of May 19, 2017:
–
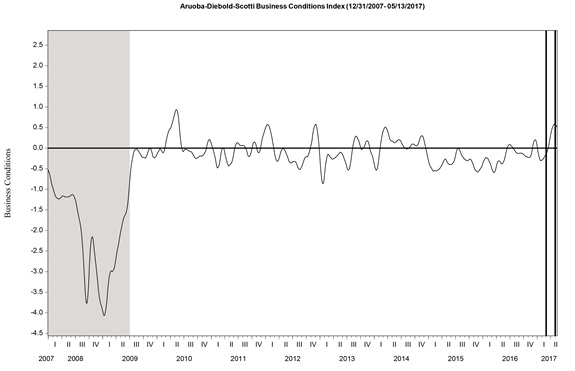
The Aruoba-Diebold-Scotti Business Conditions (ADS) Index:
Here is the latest chart, depicting the ADS Index from December 31, 2007 through May 13, 2017:
–
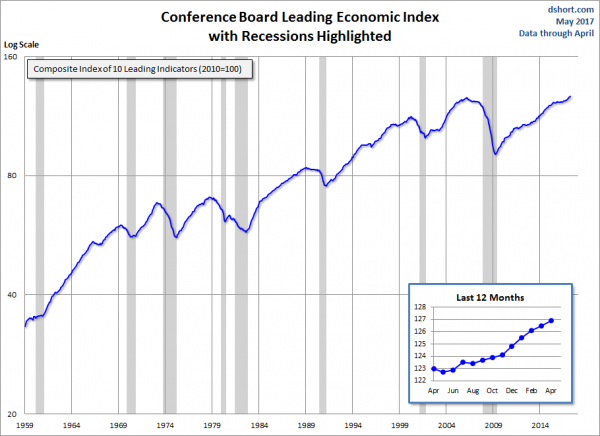
The Conference Board Leading (LEI), Coincident (CEI) Economic Indexes, and Lagging Economic Indicator (LAG):
As per the May 18, 2017 press release, titled “The Conference Board Leading Economic Index (LEI) for the U.S. Increased in April” (pdf) the LEI was at 126.9, the CEI was at 115.2, and the LAG was 124.1 in April.
An excerpt from the release:
“The recent trend in the U.S. LEI, led by the positive outlook of consumers and financial markets, continues to point to a growing economy, perhaps even a cyclical pickup,” said Ataman Ozyildirim, Director of Business Cycles and Growth Research at The Conference Board. “First quarter’s weak GDP growth is likely a temporary hiccup as the economy returns to its long-term trend of about 2 percent. While the majority of leading indicators have been contributing positively in recent months, housing permits followed by average workweek in manufacturing have been the sources of weakness among the U.S. LEI components.”
Here is a chart of the LEI from Doug Short’s Conference Board Leading Economic Index update of May 18, 2017:
_________
I post various indicators and indices because I believe they should be carefully monitored. However, as those familiar with this site are aware, I do not necessarily agree with what they depict or imply.
_____
The Special Note summarizes my overall thoughts about our economic situation
SPX at 2392.93 as this post is written