Here is an update of various indicators that are supposed to predict and/or depict economic activity. These indicators have been discussed in previous blog posts:
The April 2017 Chicago Fed National Activity Index (CFNAI) updated as of April 24, 2017:
The CFNAI, with current reading of .08:
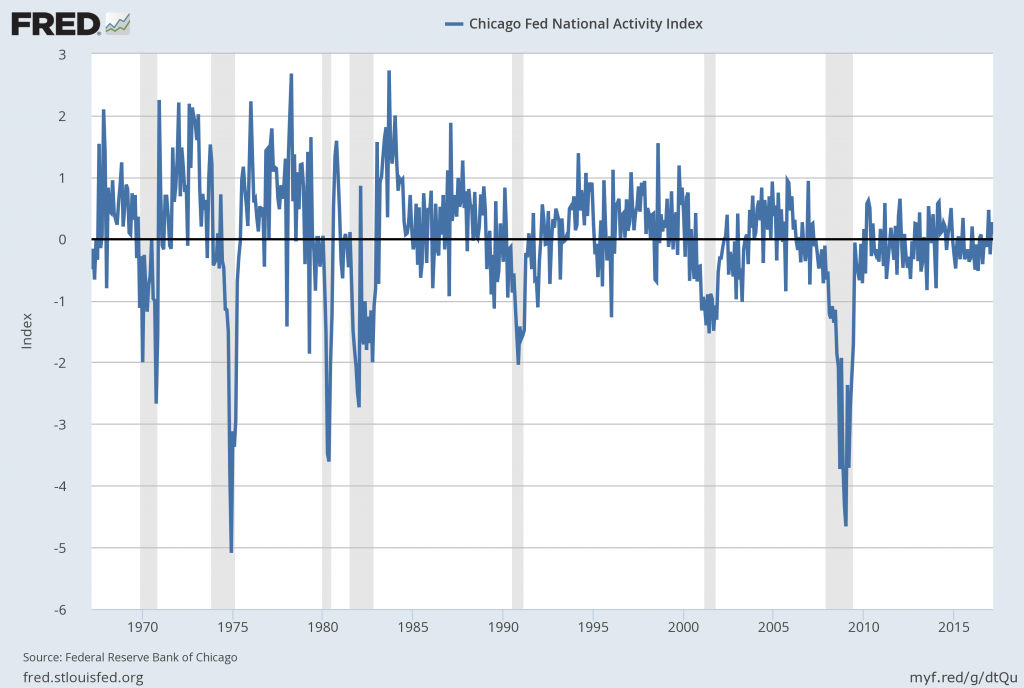
Federal Reserve Bank of Chicago, Chicago Fed National Activity Index [CFNAI], retrieved from FRED, Federal Reserve Bank of St. Louis, April 24, 2017;
https://fred.stlouisfed.org/series/CFNAI
The CFNAI-MA3, with current reading of .03:
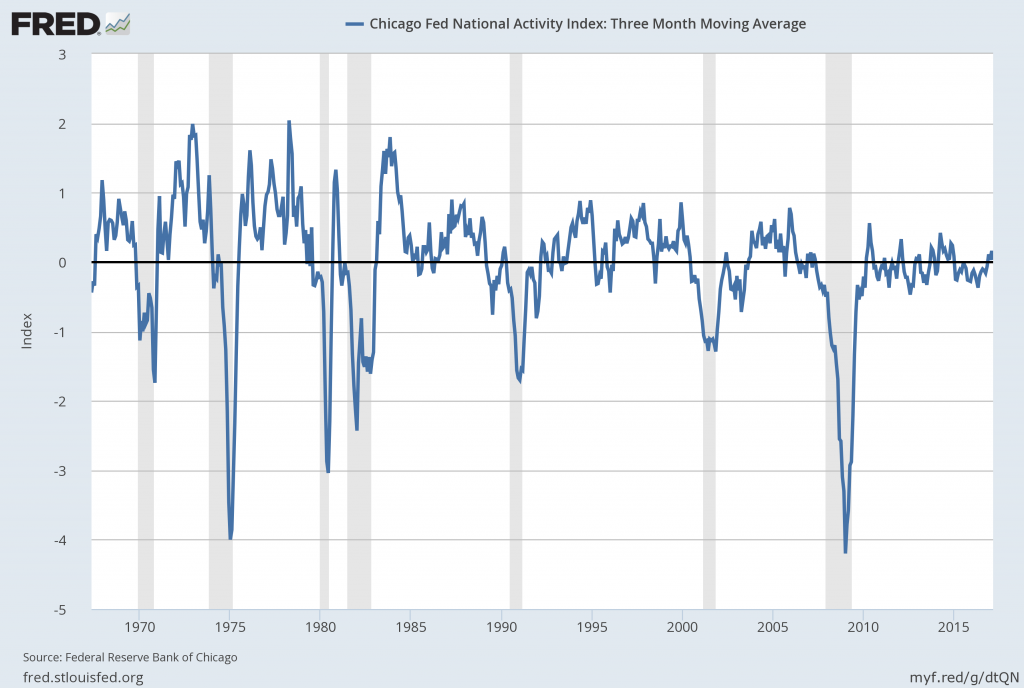
Federal Reserve Bank of Chicago, Chicago Fed National Activity Index: Three Month Moving Average [CFNAIMA3], retrieved from FRED, Federal Reserve Bank of St. Louis, April 24, 2017;
https://fred.stlouisfed.org/series/CFNAIMA3
–
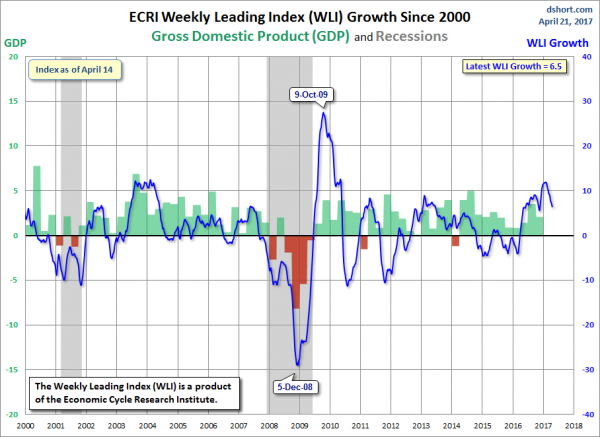
The ECRI WLI (Weekly Leading Index):
As of April 21, 2017 (incorporating data through April 14, 2017) the WLI was at 144.1 and the WLI, Gr. was at 6.5%.
A chart of the WLI,Gr., from Doug Short’s ECRI update post of April 21, 2017:
–
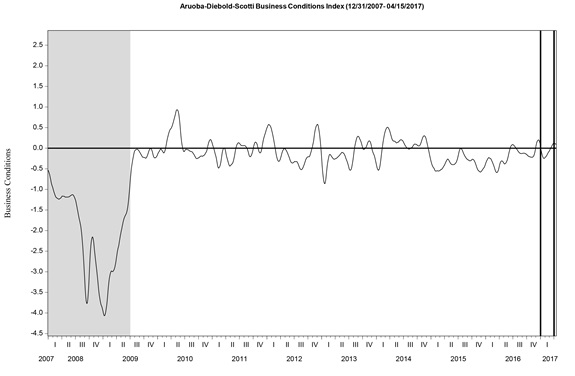
The Aruoba-Diebold-Scotti Business Conditions (ADS) Index:
Here is the latest chart, depicting the ADS Index from December 31, 2007 through April 15, 2017:
–
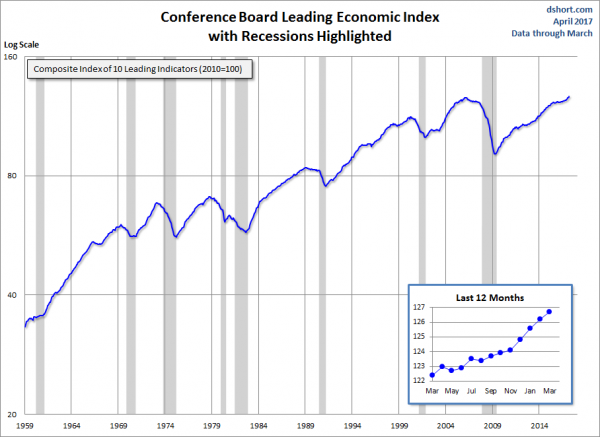
The Conference Board Leading (LEI), Coincident (CEI) Economic Indexes, and Lagging Economic Indicator (LAG):
As per the April 20, 2017 press release, titled “The Conference Board Leading Economic Index (LEI) for the U.S. Increased in March” (pdf) the LEI was at 126.7, the CEI was at 114.9, and the LAG was 123.6 in March.
An excerpt from the release:
“The March increase and upward trend in the U.S. LEI point to continued economic growth in 2017, with perhaps an acceleration later in the year if consumer spending and investment pick up,” said Ataman Ozyildirim, Director of Business Cycles and Growth Research at The Conference Board. “The gains among the leading indicators were very widespread, with new orders in manufacturing and the interest rate spread more than offsetting declines in the labor market components in March.”
Here is a chart of the LEI from Doug Short’s Conference Board Leading Economic Index update of April 20, 2017:
_________
I post various indicators and indices because I believe they should be carefully monitored. However, as those familiar with this site are aware, I do not necessarily agree with what they depict or imply.
_____
The Special Note summarizes my overall thoughts about our economic situation
SPX at 2374.76 as this post is written