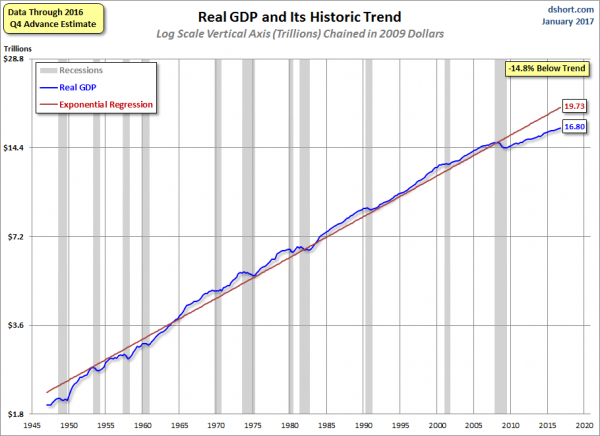
For reference purposes, below is a chart from Doug Short’s “Q4 GDP Advance Estimate: Real GDP at 1.9%, Worse Than Forecast ” post of January 27, 2017, depicting Real GDP, with a trendline, as depicted. This chart reflects the Gross Domestic Product Q4 2016 Advance Estimate (pdf) of January 27, 2017:
_____
The Special Note summarizes my overall thoughts about our economic situation
SPX at 2293.93 as this post is written