On July 5, 2016 Gallup released the poll results titled “U.S. Economic Confidence Index Steady in June at -14.”
Notable excerpts include:
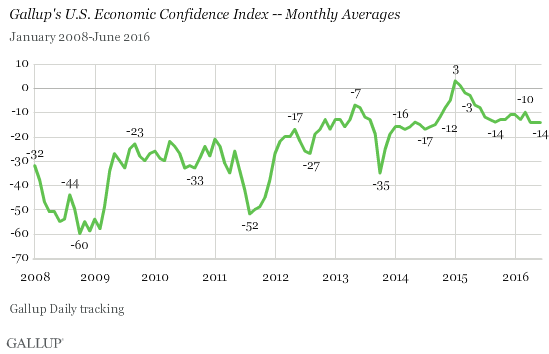
Gallup’s U.S. Economic Confidence Index averaged -14 in June, the same reading as in April and May. Confidence ticked slightly higher earlier in the month — with the index averaging -12 each of the first two weeks — but retreated near the end, with subsequent weekly readings of -15 and -17.
also:
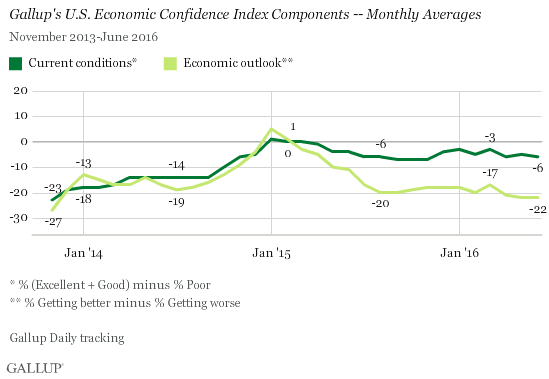
Gallup’s U.S. Economic Confidence Index is the average of two components: how Americans rate current economic conditions and whether they feel the economy is improving or getting worse. The index has a theoretical maximum of +100 if all Americans were to say the economy is doing well and improving, and a theoretical minimum of -100 if all Americans were to say the economy is doing poorly and getting worse.
In June, the current conditions score registered -6, the result of 25% of U.S. adults rating the current economy as “excellent” or “good” and 31% rating it as “poor.” June’s result is consistent with the -1 to -7 range for this component since April of last year. Meanwhile, the economic outlook score in June remained at -22, the same as in May and the lowest this component has been since November 2013. The outlook score is based on 37% of U.S. adults saying the economy is “getting better” and 59% saying it is “getting worse.”
Here is an accompanying chart of the two components of the Gallup Economic Confidence Index, discussed above:
Here is an accompanying chart of the Gallup Economic Confidence Index:
_____
The Special Note summarizes my overall thoughts about our economic situation
SPX at 2083.92 as this post is written