On Tuesday (July 5, 2016) the yield on the 10-Year Treasury closed at 1.367%, after reaching an intraday yield of 1.357%.
An excerpt from the Wall Street Journal article of July 6, 2016, titled “Are Treasuries Headed for 1%? New Lows in a 35-Year Downtrend“:
The yield on the benchmark 10-year U.S. Treasury note fell to its lowest level ever Tuesday, a new milestone in a three-decade downward run that even veteran traders never thought would go so far or last so long.
The yield closed below 1.4% for the first time at 1.367%, surpassing the previous record low set four years ago, according to data going back to 1977.
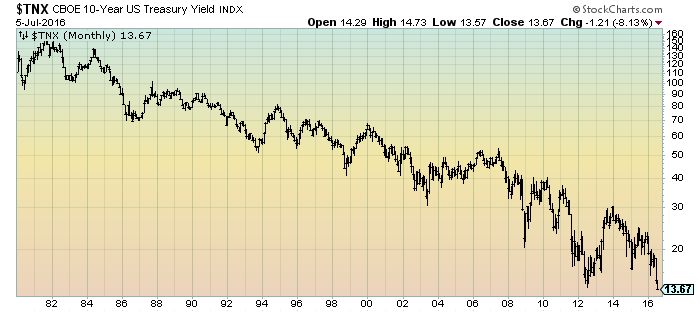
As a reference, here is a long-term chart of the 10-Year Treasury yield since 1980, depicted on a monthly basis, LOG scale:
(click on charts to enlarge images)(charts courtesy of StockCharts.com; chart creation and annotation by the author)
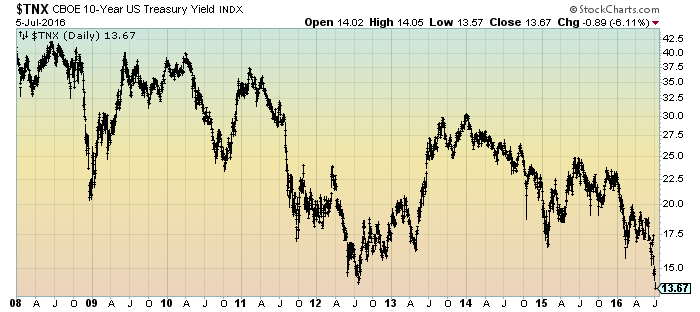
Here is a long-term chart of the 10-Year Treasury yield since 2008, depicted on a daily basis, LOG scale:
_____
The Special Note summarizes my overall thoughts about our economic situation
SPX at 2088.55 as this post is written