In the October 6, 2015 post (“Comparisons Of Economic And Financial Aspects – 2008 And 2015“) I discussed credit spreads and featured a chart of the spread between Moody’s Seasoned Baa Corporate Bond and the 10-Year Treasury Constant Maturity.
For reference, here is an updated long-term chart of that measure, with a current reading (updated as of April 11, with a value from April 8, 2016) of 3.07%:
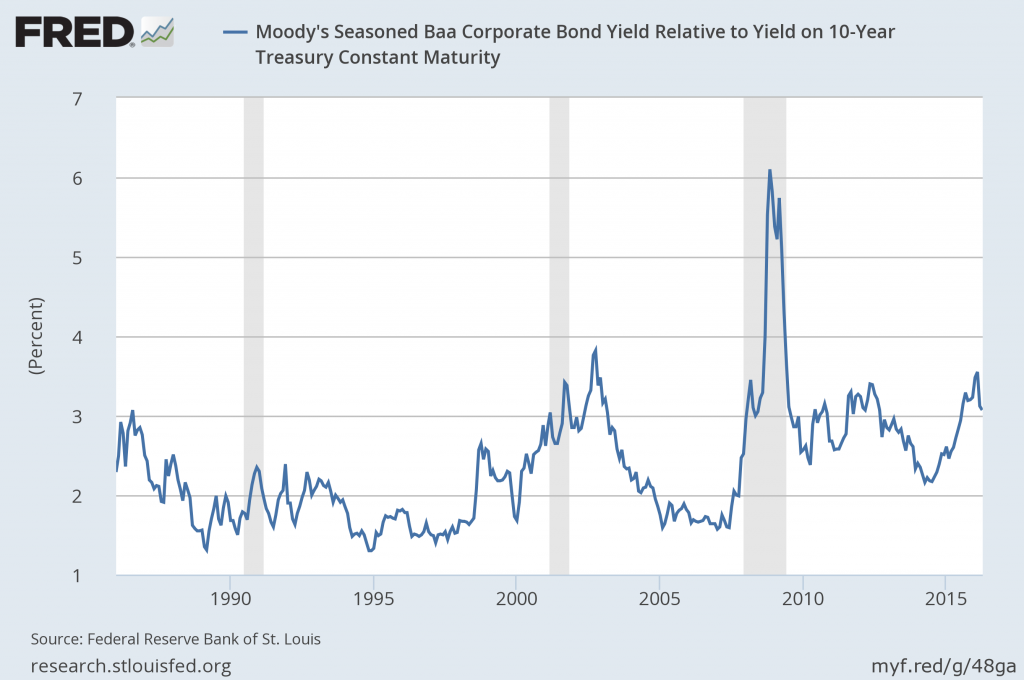
Federal Reserve Bank of St. Louis, Moody’s Seasoned Baa Corporate Bond Yield Relative to Yield on 10-Year Treasury Constant Maturity [BAA10Y], retrieved from FRED, Federal Reserve Bank of St. Louis on April 12, 2016:
https://research.stlouisfed.org/fred2/series/BAA10Y/
_____
The Special Note summarizes my overall thoughts about our economic situation
SPX at 2041.99 as this post is written