In the August 11, 2010 post (“Employment-Population Ratio – Chart And Comments“) I featured a chart of the Employment-Population Ratio and brief commentary.
For those unaware of this measure, a description is seen in the February 3, 2014 Liberty Street Economics post titled “A Mis-Leading Labor Market Indicator“:
The employment-population (E/P) ratio frequently is used as an additional labor market measure. The E/P ratio is defined as the number of employed divided by the size of the working-age, noninstitutionalized population. An advantage of the E/P ratio over the unemployment rate is that it is not impacted by discouraged workers who stop looking for employment. The E/P ratio also dominates a measure focusing just on total employment in the economy, since it adjusts for changes in the size of the working-age population.
Additional commentary regarding the Employment-Population Ratio can be seen in various sources, including the May 27, 2015 Congressional Research Service document titled “An Overview of the Employment-Population Ratio.” (pdf)
Below is an updated chart (from January 1948 through January 2016) of the ratio, . The January 2016 value is 59.6%:
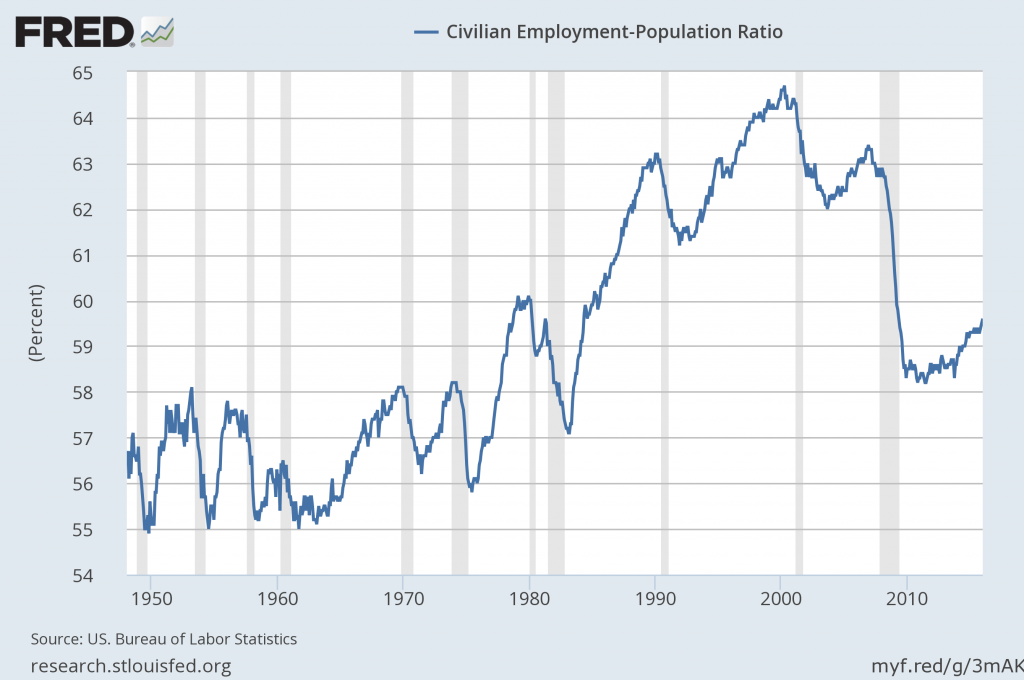
source: US. Bureau of Labor Statistics, Civilian Employment-Population Ratio [EMRATIO], retrieved from FRED, Federal Reserve Bank of St. Louis; accessed February 8, 2016;
https://research.stlouisfed.org/fred2/series/EMRATIO
_________
I post various indicators and indices because I believe they should be carefully monitored. However, as those familiar with this site are aware, I do not necessarily agree with what they depict or imply.
_____
The Special Note summarizes my overall thoughts about our economic situation
SPX at 1852.21as this post is written