For reference purposes, below are three charts that display growth in payroll employment.
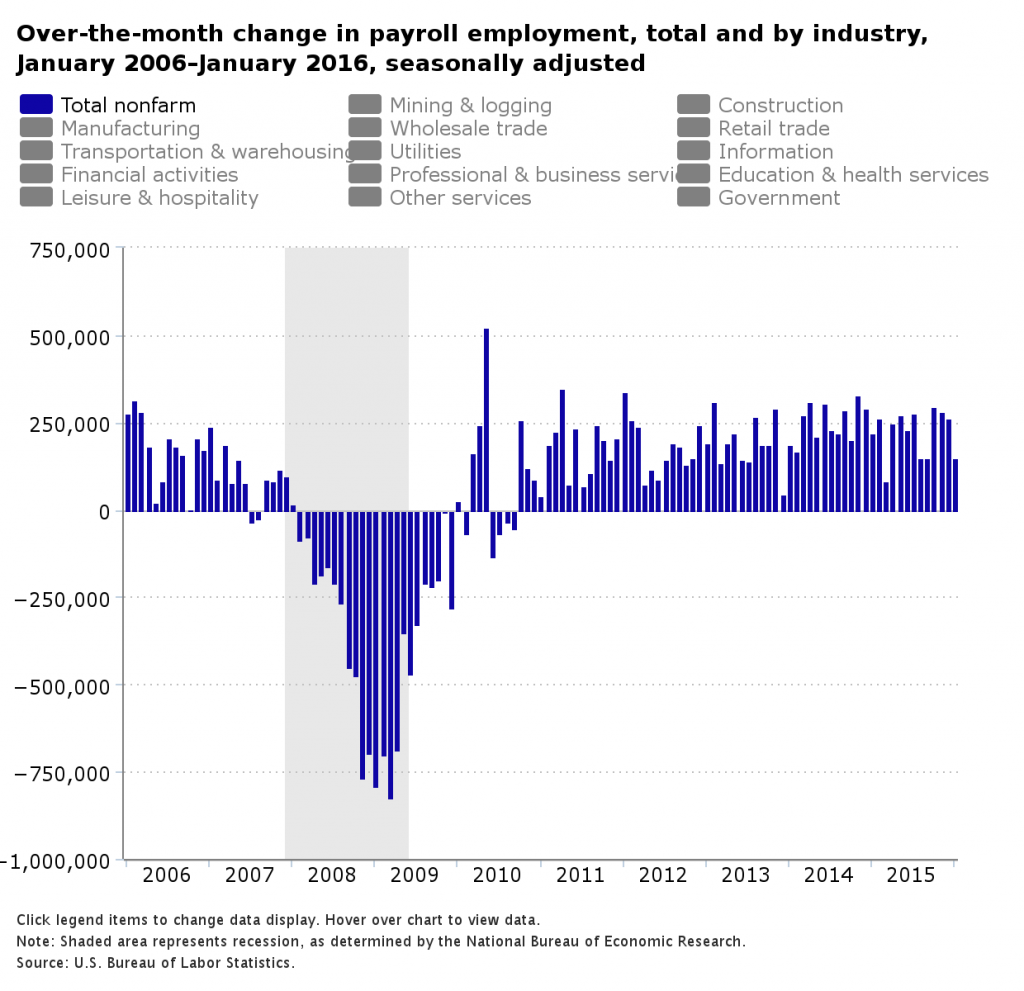
The first chart is from the Bureau of Labor Statistics (BLS) February 8, 2016 The Economics Daily (TED) post titled “Payroll employment up 151,000 in January 2016.” It shows, as stated, “Over-the-month change in (total) payroll employment” from January 2006-January 2016:
The second chart shows the month-over-month change in total nonfarm payrolls in the 1990’s: (reports of January 1990-December 1999)
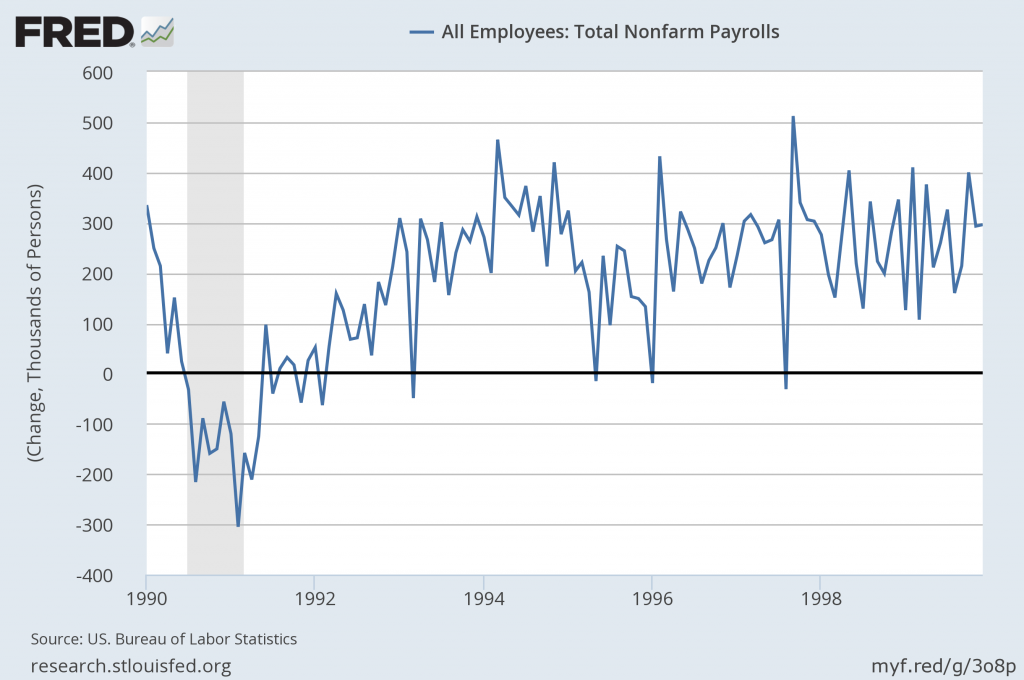
Data Source: FRED, Federal Reserve Economic Data, Federal Reserve Bank of St. Louis: All Employees: Total nonfarm [PAYEMS] ; U.S. Department of Labor: Bureau of Labor Statistics; accessed February 8, 2016;
https://research.stlouisfed.org/fred2/series/PAYEMS
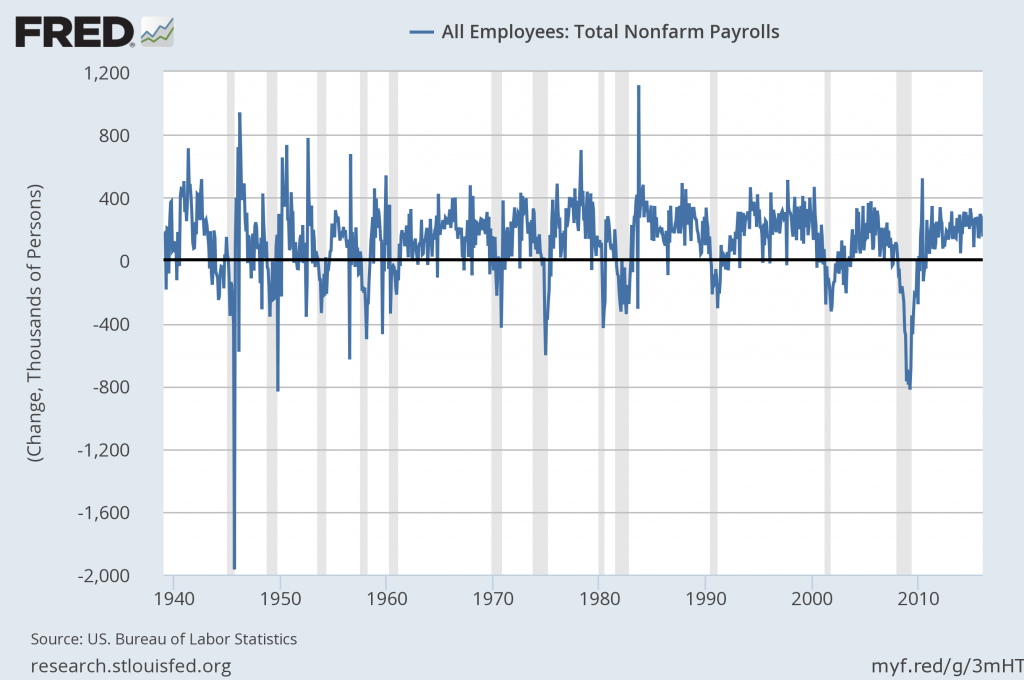
The third chart shows a long-term chart of the same month-over-month change in total nonfarm payrolls (reports of January 1939 to the present report of January 2016):
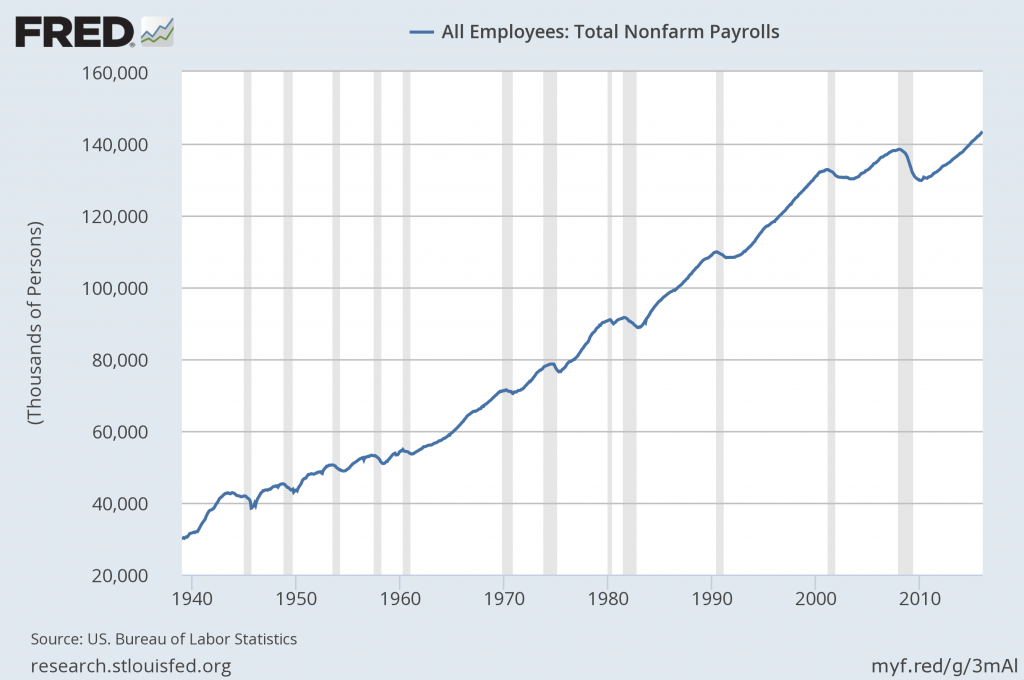
Lastly, the chart below shows the aggregate number of total nonfarm payrolls, from January 1939 – January 2016 (January 2016 value of 143.288 million):
_________
I post various indicators and indices because I believe they should be carefully monitored. However, as those familiar with this blog are aware, I do not necessarily agree with what they depict or imply.
_____
The Special Note summarizes my overall thoughts about our economic situation
SPX at 1853.44 as this post is written