Here is an update on various indicators that are supposed to predict and/or depict economic activity. These indicators have been discussed in previous blog posts:
The June Chicago Fed National Activity Index (CFNAI)(pdf) updated as of June 24, 2013:
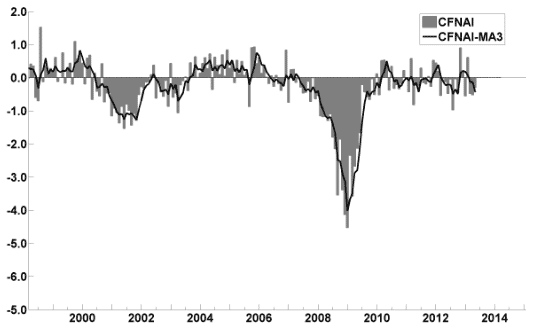
–
The ECRI WLI (Weekly Leading Index):
As of 6/21/13 (incorporating data through 6/14/13) the WLI was at 130.3 and the WLI, Gr. was at 6.2%.
A chart of the WLI, Gr. since 2000, from Doug Short’s blog of June 21 titled “ECRI Recession Watch: Weekly Update” :
–
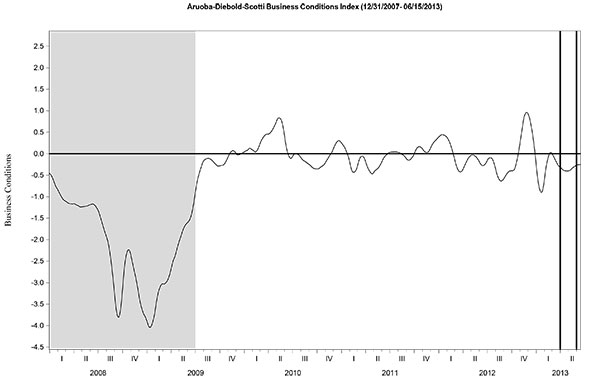
The Aruoba-Diebold-Scotti Business Conditions (ADS) Index:
Here is the latest chart, depicting 12-31-07 through 6-15-13:
–
The Conference Board Leading (LEI) and Coincident (CEI) Economic Indexes:
As per the June 20 press release, the LEI was at 95.2 and the CEI was at 105.6 in May.
An excerpt from the June 20 release:
Says Ataman Ozyildirim, economist at The Conference Board: “Despite month-to-month volatility, the LEI’s six-month growth rate remains steady, suggesting that conditions in the economy remain resilient. Widespread gains in the leading indicators over the last six months suggest there is some upside potential for economic activity in the second half of the year.”
Here is a chart of the LEI from Doug Short’s blog post of June 20 titled “Conference Board Leading Economic Index: A Slight Rise in May” :
_________
I post various indicators and indices because I believe they should be carefully monitored. However, as those familiar with this blog are aware, I do not necessarily agree with what they depict or imply.
_____
The Special Note summarizes my overall thoughts about our economic situation
SPX at 1565.30 as this post is written