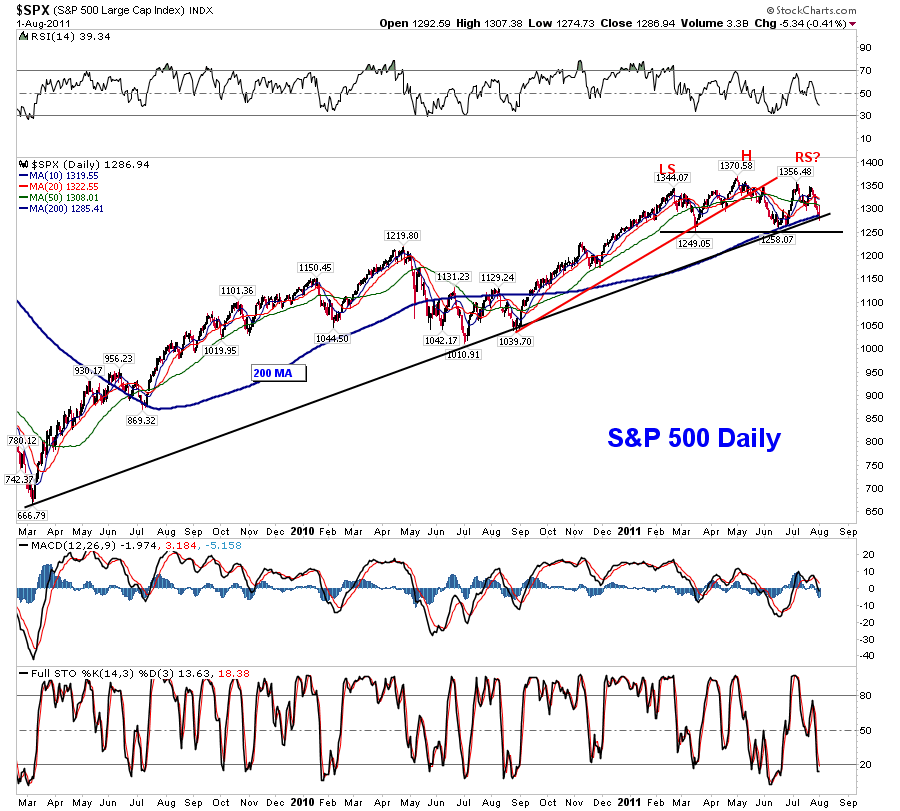
The following chart is annotated by Ron Walker, of thechartpatterntrader.com :
(click on chart to enlarge image)(chart courtesy of StockCharts.com)
As one can see, it is a chart of the S&P500 on a daily basis since March of 2009. Yesterday’s closing price of the S&P500 (1286.94) is very near the black rising trendline from the March 2009 low.
Other aspects of the chart that I find notable is the slowing price momentum since the 1344.07 high, as annotated. There is a possibility of a “Head & Shoulders” formation, as shown.
Furthermore, one can see that the 200dma (in blue) has served as technical support a number of times recently.
In my opinion, all of the above serve to illustrate that the stock market is at an important crossroads here from a Technical Analysis perspective.
_____
The Special Note summarizes my overall thoughts about our economic situation
SPX at 1286.94 as this post is written
