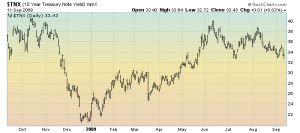
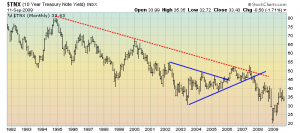
I have included two charts of the Ten-Year Treasury yields below – one daily and one monthly. The monthly is provided for a longer-term perspective.
I would like to address the daily chart. It seems odd that in an environment in which
- inflation is (purportedly) a growing concern
- the economy is supposedly recovering faster than anticipated
- Treasury debt auctions have been materially increasing in size
that since roughly early June, the Ten-Year Treasury yield has been decreasing:
Ten-Year Treasury Yield Daily 1-Year Chart
Chart Courtesy of StockCharts.com
Ten-Year Treasury Yield Monthly Chart
Chart Courtesy of StockCharts.com
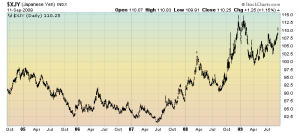
Additionally, is it not odd, on an “all things considered” basis, that the Japanese Yen is rising at what appears to be an increasing rate? This rise commenced in mid-2007, as seen below:

Chart Courtesy of StockCharts.com
Now on to Part III…
SPX at 1042.73 as this post is written

