Throughout this site there are many discussions of economic indicators. This post is the latest in a series of posts indicating facets of U.S. economic weakness or a notably low growth rate.
The level and trend of economic growth is especially notable at this time. As seen in various estimates, the probability of recession has grown significantly.
As seen in the January 2023 Wall Street Journal Economic Forecast Survey the consensus (average estimate) among various economists is for .17% GDP in 2023, 1.86% GDP in 2024, and 2.22% GDP in 2025.
Charts Indicating U.S. Economic Weakness
Below is a small sampling of charts that depict weak growth or contraction, and a brief comment for each:
The Yield Curve (T10Y2Y)
Many people believe that the Yield Curve is a leading economic indicator for the United States economy.
On March 1, 2010, I wrote a post on the issue, titled “The Yield Curve As A Leading Economic Indicator.”
While I continue to have the stated reservations regarding the “Yield Curve” as an indicator, I do believe that it should be monitored.
The U.S. Yield Curve (one proxy seen below) is negative and is (all things considered) notably very low when viewed from a long-term perspective. Below is the spread between the 10-Year Treasury Constant Maturity and the 2-Year Treasury Constant Maturity from June 1976 through the April 7, 2023 update, showing a value of -.58% [10-Year Treasury Yield (FRED DGS10) of 3.30% as of the April 7 update, 2-Year Treasury Yield (FRED DGS2) of 3.82% as of the April 7 update]:
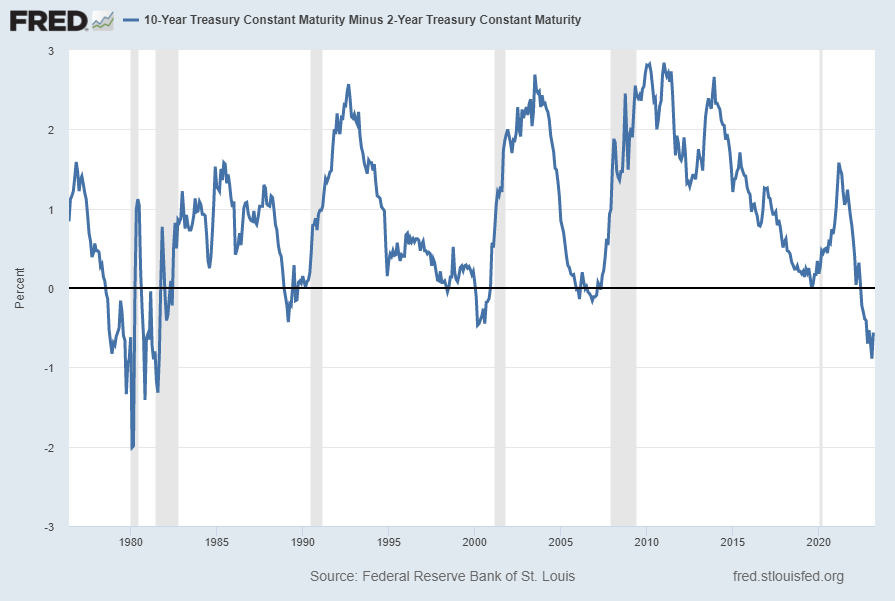
source: Federal Reserve Bank of St. Louis, 10-Year Treasury Constant Maturity Minus 2-Year Treasury Constant Maturity [T10Y2Y], retrieved from FRED, Federal Reserve Bank of St. Louis; accessed April 7, 2023: https://fred.stlouisfed.org/series/T10Y2Y
__
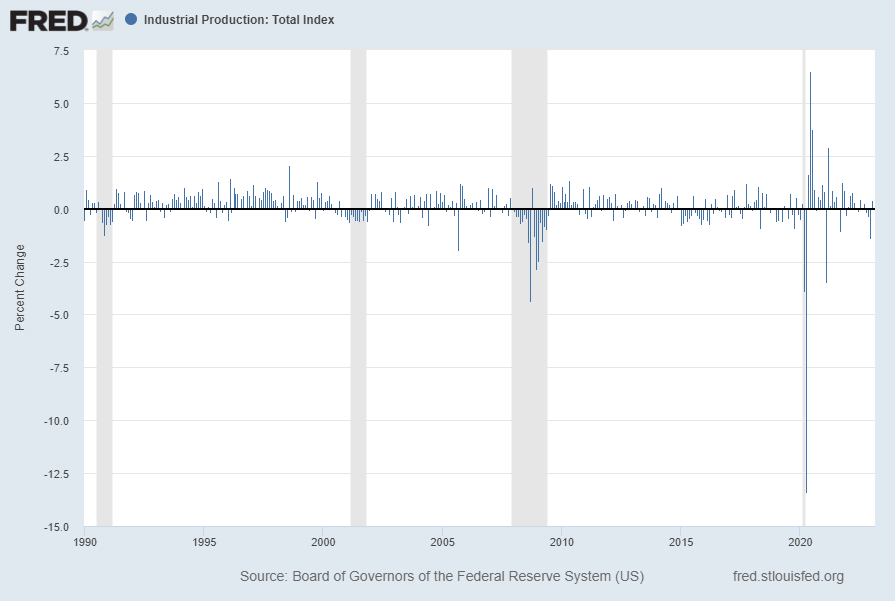
Industrial Production (INDPRO)
The “Industrial Production” measure is recently exhibiting tepid growth. Shown below is a long-term chart of this measure (displayed from 2000), with last value of 102.004 through February 2023, last updated March 28, 2023:

Displayed below is this INDPRO measure on a “Percent Change” basis since 1990 with last value 0.0%:
Displayed below is this INDPRO measure on a “Percent Change From Year Ago” basis since 1990 with value 0.3%:
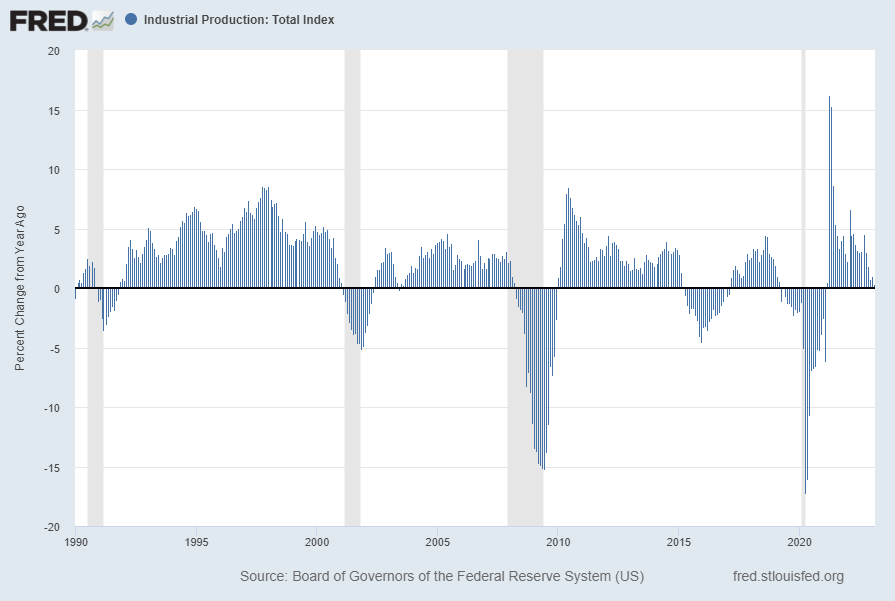
source: Board of Governors of the Federal Reserve System (US), Industrial Production: Total Index [INDPRO], retrieved from FRED, Federal Reserve Bank of St. Louis; accessed April 8, 2023: https://fred.stlouisfed.org/series/INDPRO
__
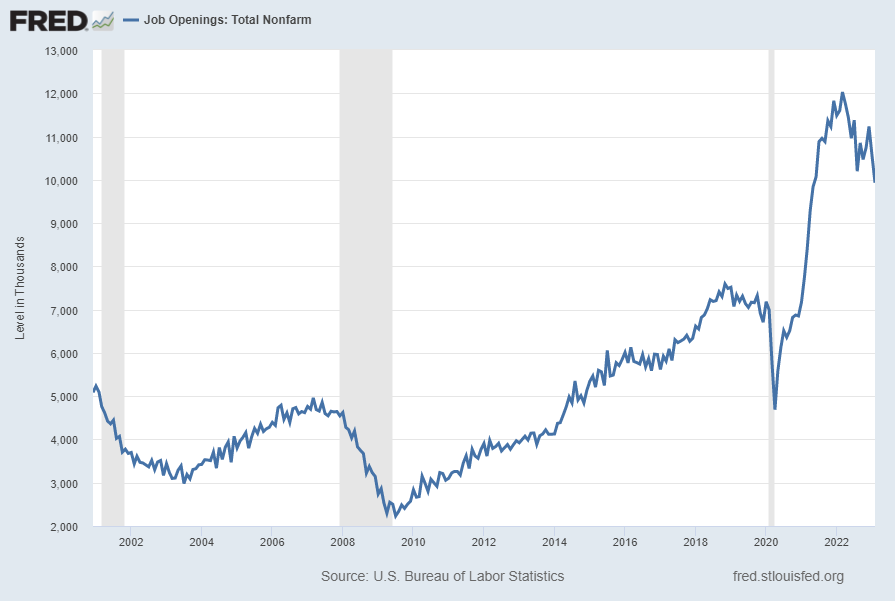
Job Openings (JTSJOL)
Job openings (Job Openings: Total Nonfarm [JTSJOL]), although still at a (very) high level, have recently declined significantly. This Job Openings measure had a value of 9,931 (Thousands) through February 2023, as of the April 4, 2023 update, as shown below:
Below is this measure displayed on a “Percent Change From Year Ago” basis with value -14.4%:

source: U.S. Bureau of Labor Statistics, Job Openings: Total Nonfarm [JTSJOL], retrieved from FRED, Federal Reserve Bank of St. Louis; accessed April 8, 2023: https://fred.stlouisfed.org/series/JTSJOL
__
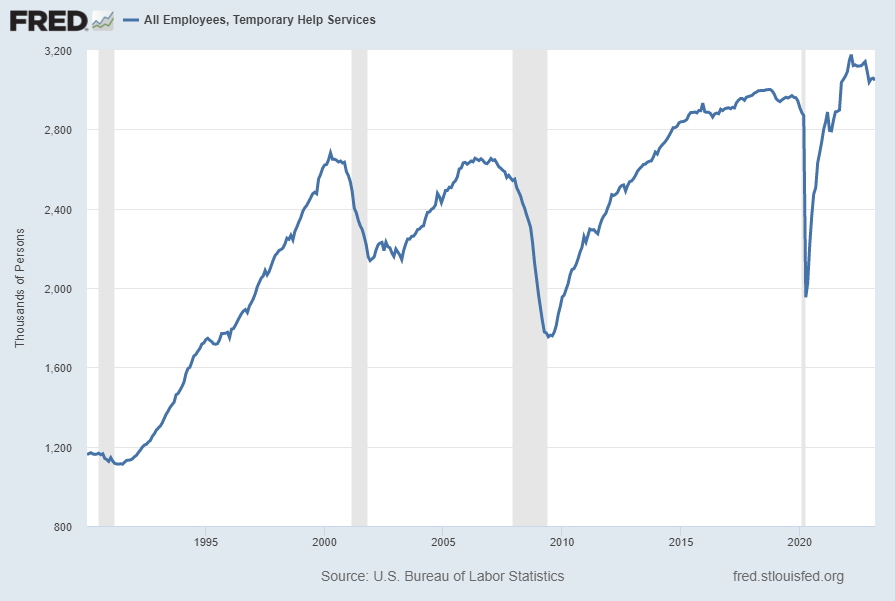
All Employees, Temporary Help Services (TEMPHELPS)
I have written extensively about many facets of employment and unemployment, as the current and future unemployment issue is of tremendous importance yet is in many ways misunderstood.
One theory regarding employment is that hiring cycles typically begin with an uptake in temporary employment. Conversely, due to various factors a reduction in temporary employees can be an (early) indicator of lessening labor demand.
Shown below is this measure with last value of 3,047.2 (Thousands) through March, last updated April 7, 2023:
Below is this measure displayed on a “Percent Change From Year Ago” basis with value -4.1%:
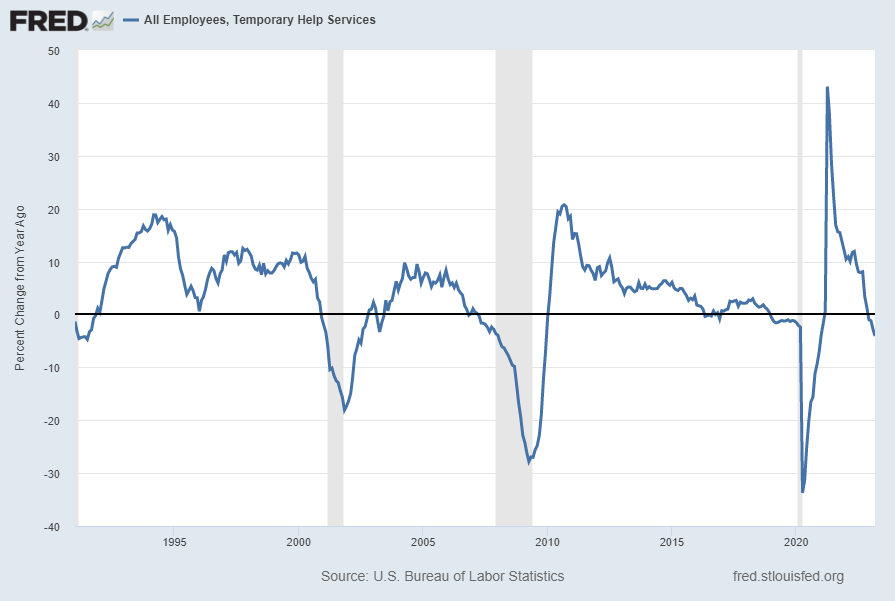
source: U.S. Bureau of Labor Statistics, All Employees, Temporary Help Services [TEMPHELPS], retrieved from FRED, Federal Reserve Bank of St. Louis; accessed April 8, 2023: https://fred.stlouisfed.org/series/TEMPHELPS
__
Other Indicators
As mentioned previously, many other indicators discussed on this site indicate weak economic growth or economic contraction, if not outright (gravely) problematical economic conditions.
_____
The Special Note summarizes my overall thoughts about our economic situation
SPX at 4105.02 as this post is written