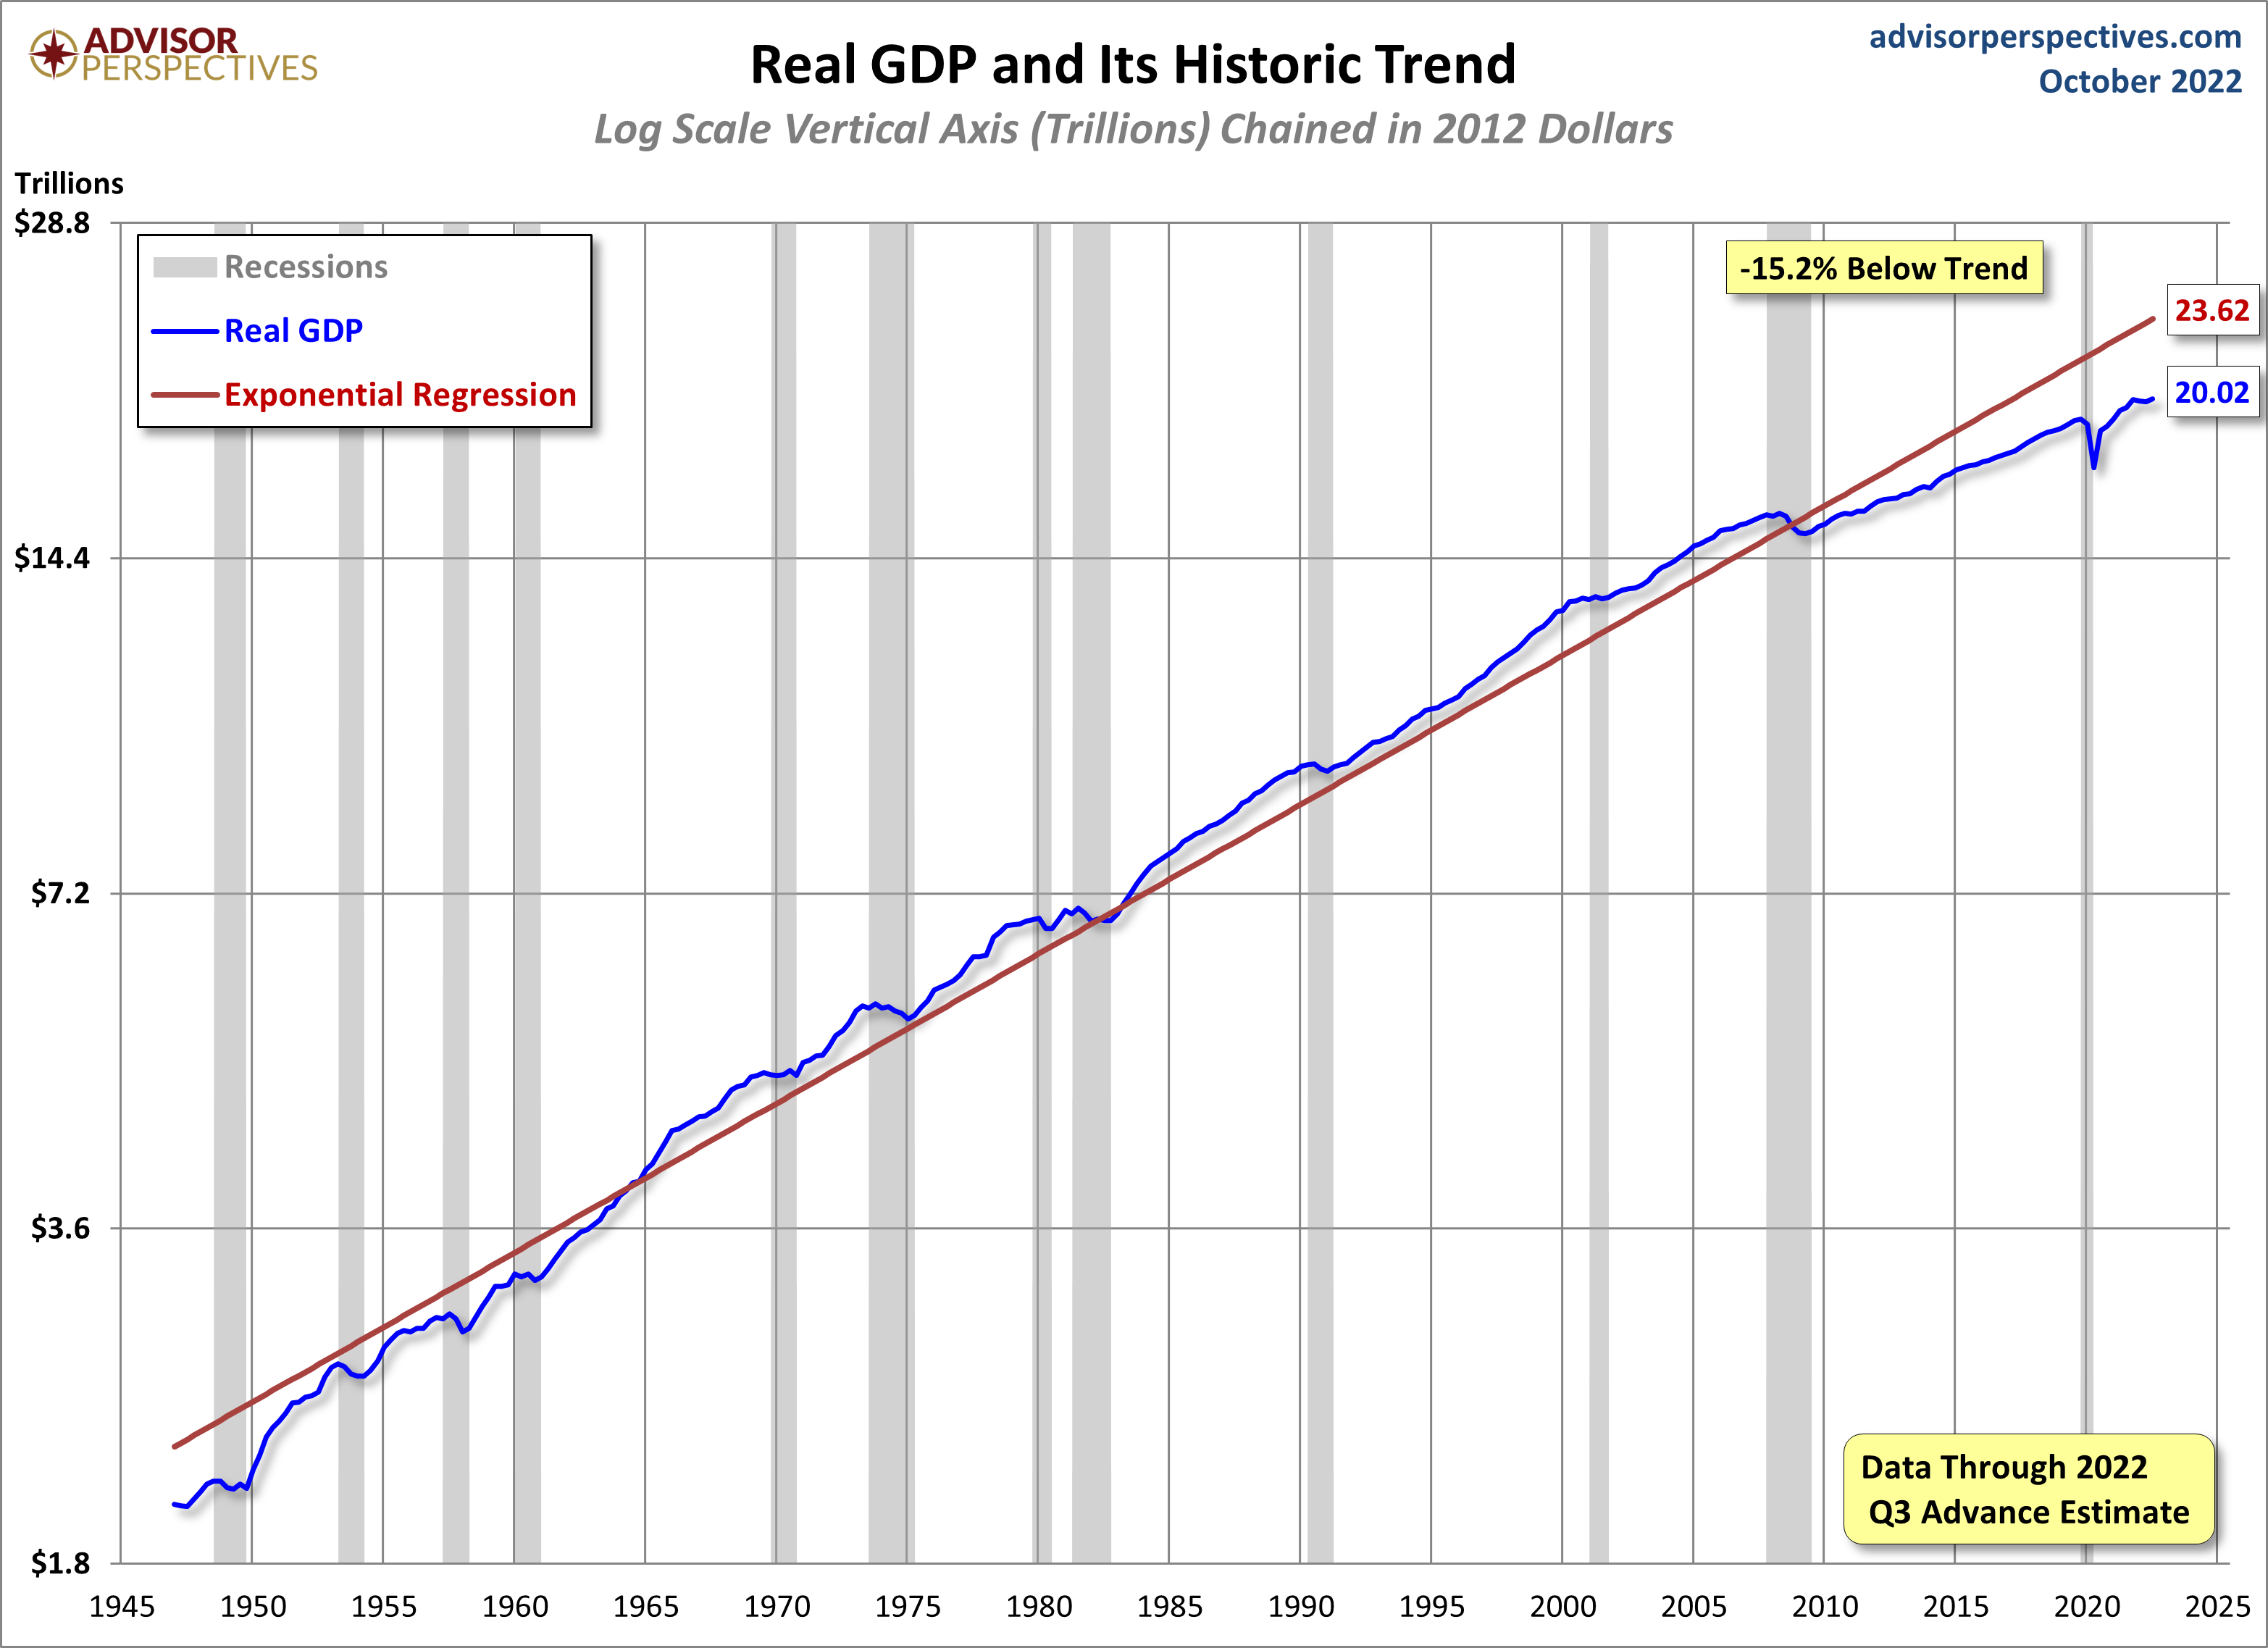
For reference purposes, below is a chart from the Advisor Perspectives’ post of October 27, 2022 titled “Q3 GDP Advance Estimate: Real GDP at 2.6%” reflecting Real GDP, with a trendline, as depicted. This chart incorporates the Gross Domestic Product, Third Quarter 2022 (Advance Estimate) of October 27, 2022:
_________
I post various indicators and indices because I believe they should be carefully monitored. However, as those familiar with this site are aware, I do not necessarily agree with what they depict or imply.
_____
The Special Note summarizes my overall thoughts about our economic situation
SPX at 3844.44 as this post is written