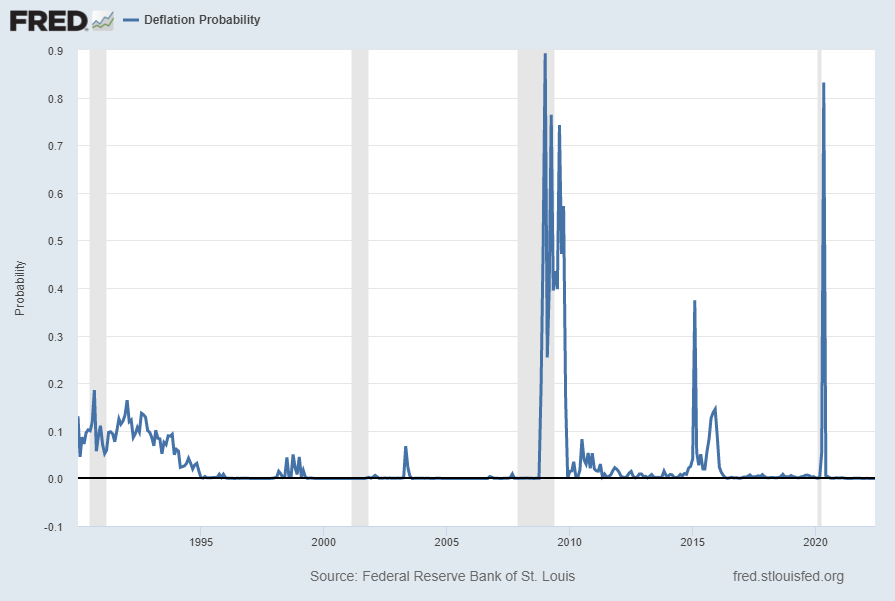
For reference, below is a chart of the St. Louis Fed Price Pressures Measures – Deflation Probability [FRED STLPPMDEF] through June 2022.
While I do not necessarily agree with the current readings of the measure, I view this as a proxy of U.S. deflation probability.
A description of this measure, as seen in FRED:
This series measures the probability that the personal consumption expenditures price index (PCEPI) inflation rate (12-month changes) over the next 12 months will fall below zero.
The chart, on a monthly basis from January 1990 – June 2022, with a last reading of .00001, last updated on June 30, 2022:
Here is this same U.S. deflation probability measure since 2008:
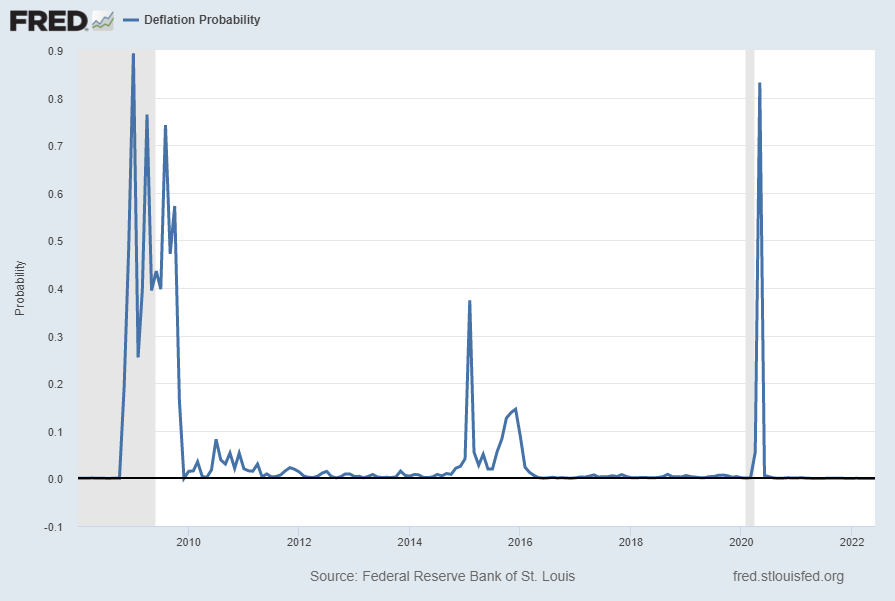
source: Federal Reserve Bank of St. Louis, Deflation Probability [STLPPMDEF], retrieved from FRED, Federal Reserve Bank of St. Louis; accessed June 30, 2022: https://fred.stlouisfed.org/series/STLPPMDEF
_________
I post various economic indicators and indices because I believe they should be carefully monitored. However, as those familiar with this site are aware, I do not necessarily agree with what they depict or imply.
_____
The Special Note summarizes my overall thoughts about our economic situation
SPX at 3785.38 as this post is written