U.S. Economic Indicators
Throughout this site there are many discussions of economic indicators. This post is the latest in a series of posts indicating facets of U.S. economic weakness or a notably low growth rate.
The level and trend of economic growth is especially notable at this time. As seen in various measures and near-term projections, the U.S. economy had undergone an outsized level of economic contraction in 2020. However, most people believe (and virtually all prominent economic forecasts indicate) that this historic level of contraction will have proven ephemeral in nature; i.e. an economic expansion will continue.
As seen in the April 2022 Wall Street Journal Economic Forecast Survey the consensus (average estimate) among various economists is for 2.57% GDP growth in 2022, 2.18% GDP growth in 2023, and 2.06% GDP growth in 2024.
Charts Indicating U.S. Economic Weakness
Below are a small sampling of charts that depict weak growth or contraction, and a brief comment for each:
__
Real Average Hourly Earnings
Various measures of (nominal) average hourly earnings continue to show significant growth. However, due to continuing high inflation, Real Average Hourly Earnings continues to decline. Shown below is a chart of earnings measures as seen in The Economics Daily of May 18, 2022 titled “Real average hourly earnings decreased 2.6 percent from April 2021 to April 2022”:
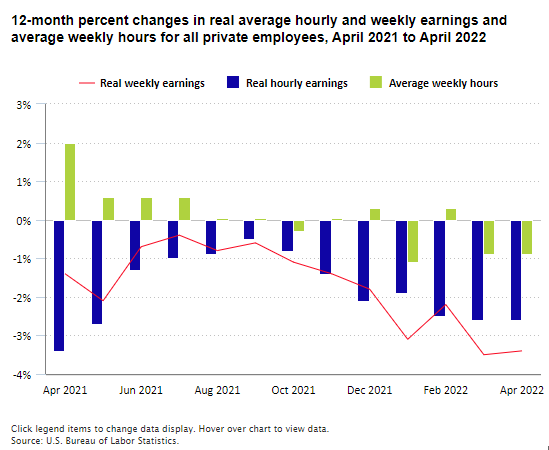
As seen in this The Economics Daily:
April 2022 is the thirteenth consecutive month of over-the-year decreases in real average hourly earnings; the last increase was 1.7 percent for the year ended March 2021.
source: Bureau of Labor Statistics, U.S. Department of Labor, The Economics Daily, Real average hourly earnings decreased 2.6 percent from April 2021 to April 2022 at https://www.bls.gov/opub/ted/2022/real-average-hourly-earnings-decreased-2-6-percent-from-april-2021-to-april-2022.htm (visited June 07, 2022).
__
Real Disposable Personal Income (DSPIC96)
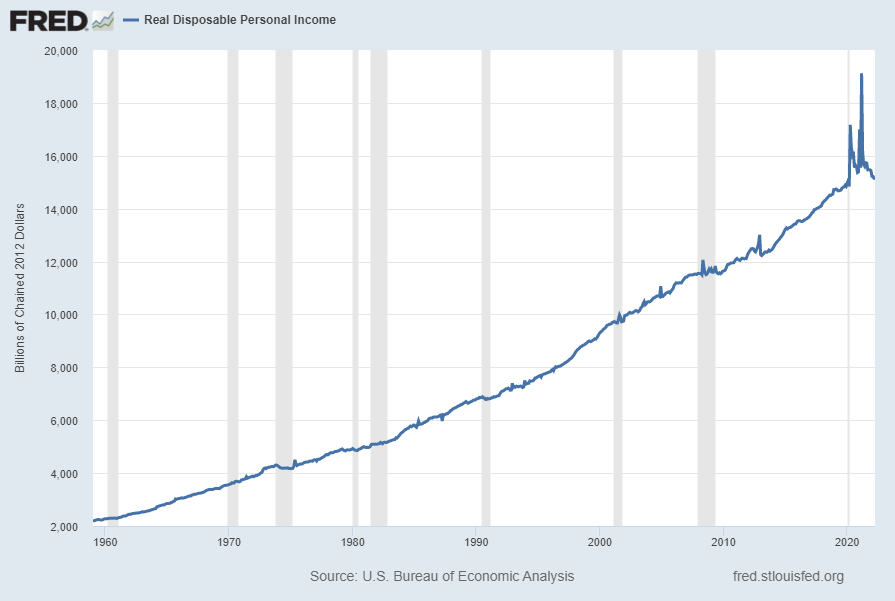
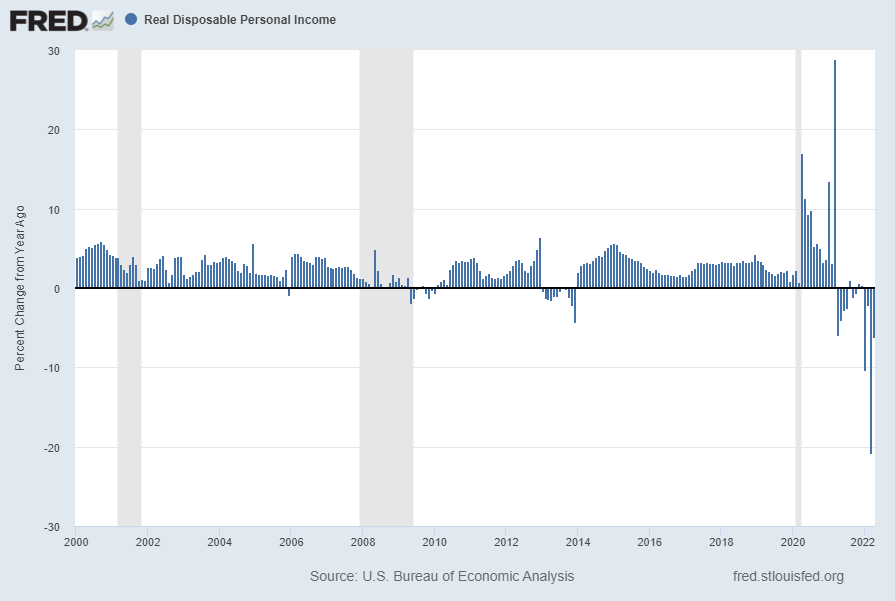
“Real Disposable Personal Income” (DSPIC96) has been volatile since 2020, and ongoing high inflation is presenting a hurdle to its continued growth. Shown below is this measure with last value of $15,153.2 Billion through April, last updated May 27, 2022:
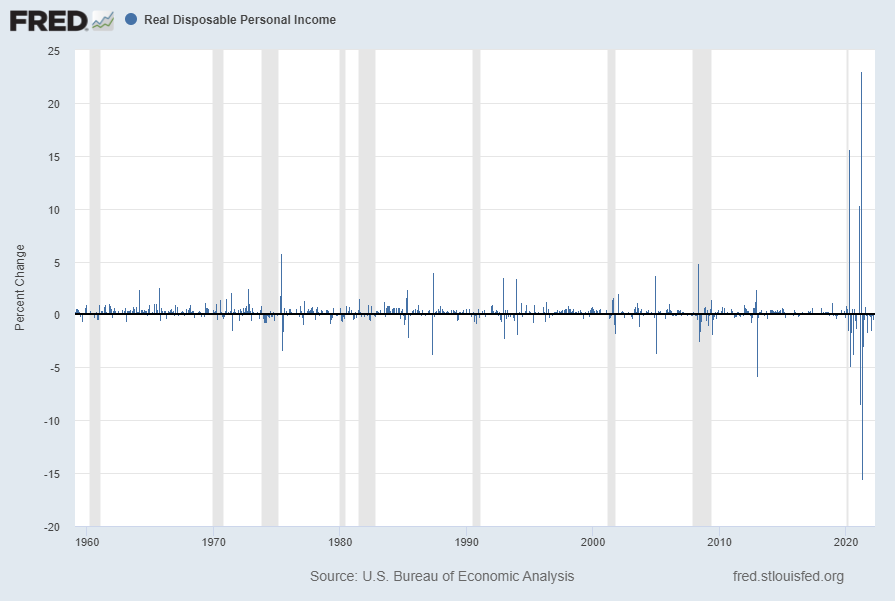
Below is this measure displayed on a “Percent Change” (from prior month) basis with last value of 0.0%:
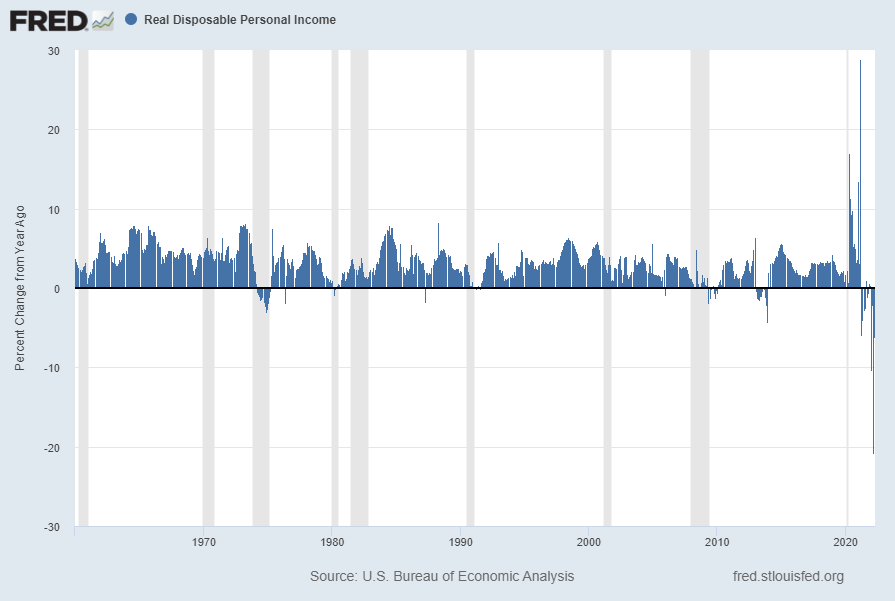
Below is this measure displayed on a “Percent Change From Year Ago” basis with value -6.2%:
Below is this same measure (“Percent Change From Year Ago” basis) but from the year 2000 onward:
source: U.S. Bureau of Economic Analysis, Real Disposable Personal Income [DSPIC96], retrieved from FRED, Federal Reserve Bank of St. Louis; accessed June 7, 2022: https://fred.stlouisfed.org/series/DSPIC96
__
Personal Income (PI)
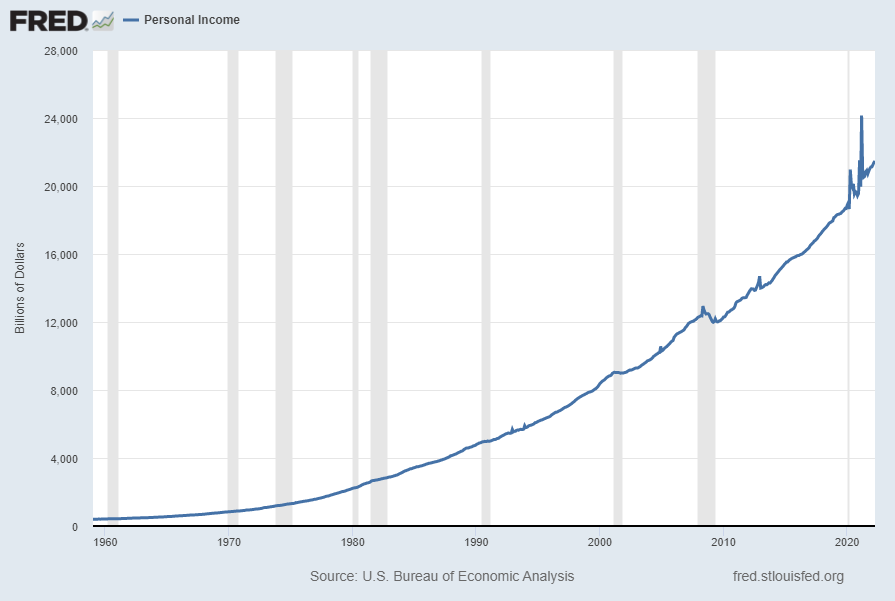
“Personal Income” (PI), which is presented on a nominal basis, has been volatile; it continues to increase after the 2020 & 2021 spikes. Shown below is this measure with last value of $21,469.80 Billion through April, last updated May 27, 2022:
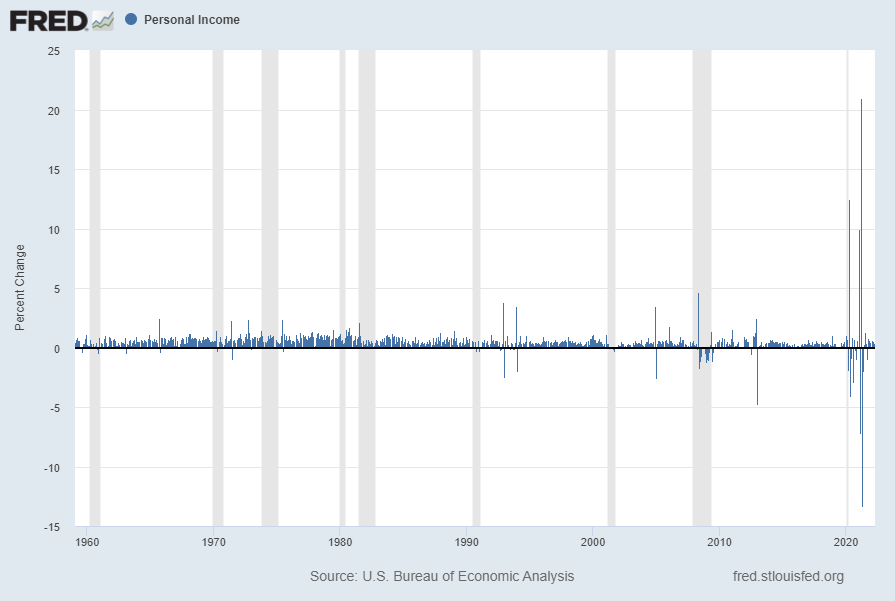
Below is this measure displayed on a “Percent Change” (from prior month) basis with last value of .4%:
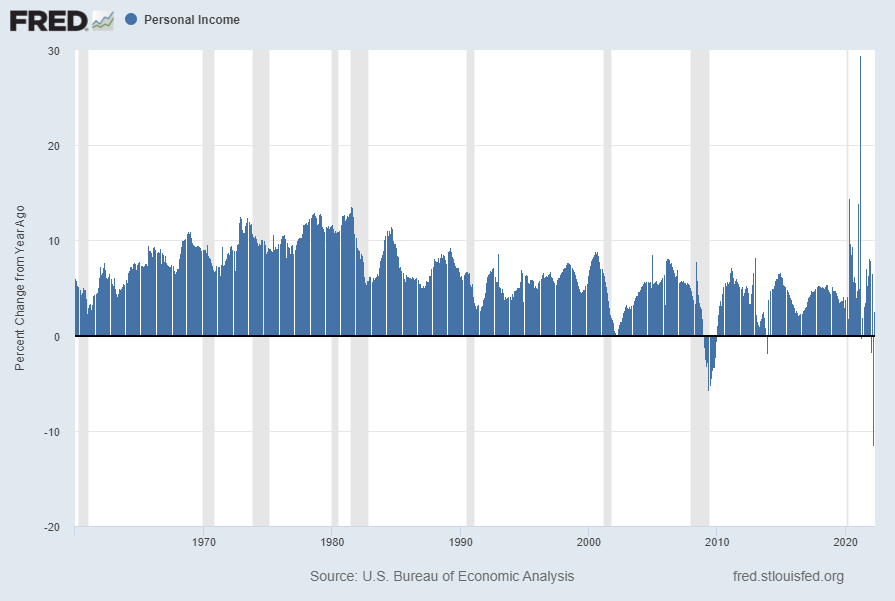
Below is this measure displayed on a “Percent Change From Year Ago” basis with value 2.6%:
source: U.S. Bureau of Economic Analysis, Personal Income [PI], retrieved from FRED, Federal Reserve Bank of St. Louis; accessed June 7, 2022: https://fred.stlouisfed.org/series/PI
__
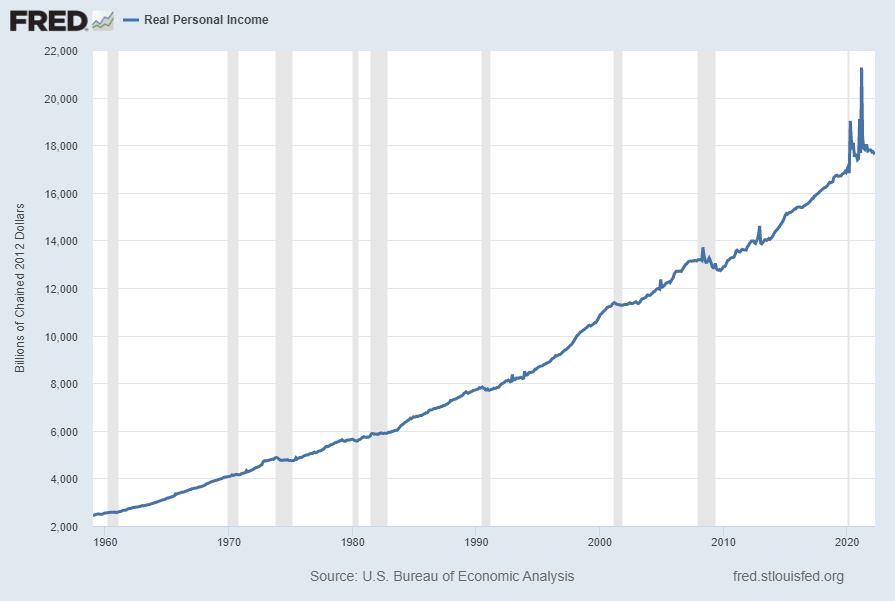
Real Personal Income (RPI)
“Real Personal Income” (RPI), has been volatile; it is faltering following the 2020 & 2021 spikes. Shown below is this measure with last value of $17,696.358 Billion through April, last updated May 27, 2022:
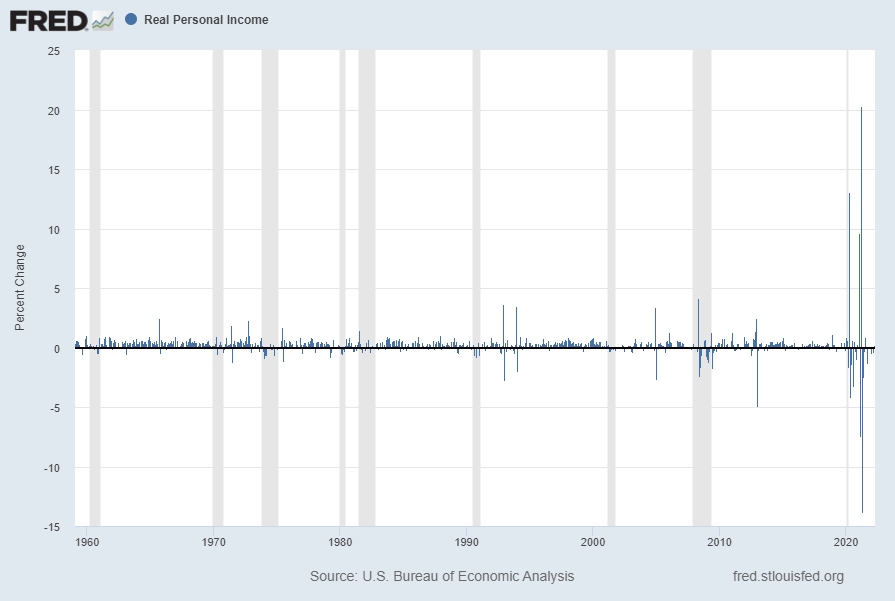
Below is this measure displayed on a “Percent Change” (from prior month) basis with last value of .2%:
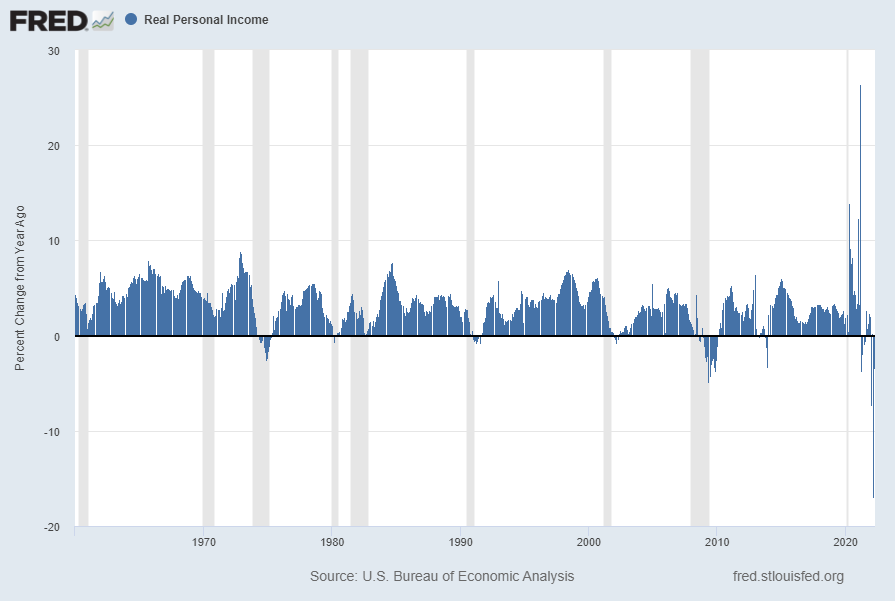
Below is this measure displayed on a “Percent Change From Year Ago” basis with value -3.5%:
source: U.S. Bureau of Economic Analysis, Real Personal Income [RPI], retrieved from FRED, Federal Reserve Bank of St. Louis; accessed June 7, 2022: https://fred.stlouisfed.org/series/RPI
__
Other Indicators
As mentioned previously, many other indicators discussed on this site indicate slow economic growth or economic contraction, if not outright (gravely) problematical economic conditions.
_____
The Special Note summarizes my overall thoughts about our economic situation
SPX at 4154.84 as this post is written