Although there was an official declaration of U.S. recession on June 8, 2020 (as discussed in the “Recession Declared For The United States By The NBER BCDC” post), the following discussion is warranted for many reasons. Among the reasons is that two of the measures mentioned below are “forward-looking” in nature.
There are a variety of economic models that are supposed to predict the probabilities of recession.
While I don’t agree with the methodologies employed or probabilities of impending economic weakness as depicted by the following two models, I think the results of these models should be monitored.
Please note that each of these models is updated regularly, and the results of these – as well as other recession models – can fluctuate significantly.
The first is the “Yield Curve as a Leading Indicator” from the New York Federal Reserve. I wrote a post concerning this measure on March 1, 2010, titled “The Yield Curve as a Leading Indicator.”
Currently (last updated October 6, 2020 using data through September 2020) this “Yield Curve” model shows a 18.5896% probability of a recession in the United States twelve months ahead. For comparison purposes, it showed a 18.9279% probability through August 2020, and a chart going back to 1960 is seen at the “Probability Of U.S. Recession Predicted by Treasury Spread.” (pdf)
The second model is from Marcelle Chauvet and Jeremy Piger. This model is described on the St. Louis Federal Reserve site (FRED) as follows:
Smoothed recession probabilities for the United States are obtained from a dynamic-factor markov-switching model applied to four monthly coincident variables: non-farm payroll employment, the index of industrial production, real personal income excluding transfer payments, and real manufacturing and trade sales. This model was originally developed in Chauvet, M., “An Economic Characterization of Business Cycle Dynamics with Factor Structure and Regime Switching,” International Economic Review, 1998, 39, 969-996. (http://faculty.ucr.edu/~chauvet/ier.pdf)
Additional details and explanations can be seen on the “U.S. Recession Probabilities” page.
This model, last updated on October 1, 2020 currently shows a 100.00% probability using data through August 2020.
Here is the FRED chart (last updated October 1, 2020):
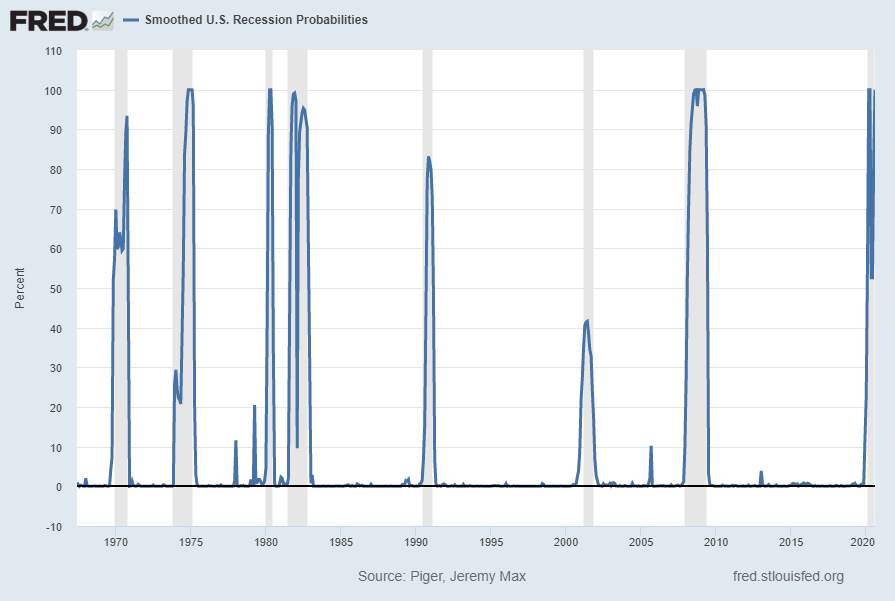
Data Source: Piger, Jeremy Max and Chauvet, Marcelle, Smoothed U.S. Recession Probabilities [RECPROUSM156N], retrieved from FRED, Federal Reserve Bank of St. Louis, accessed October 6, 2020:
http://research.stlouisfed.org/fred2/series/RECPROUSM156N
–
The two models featured above can be compared against measures seen in recent posts. For instance, as seen in the September 10, 2020 post titled “The September 2020 Wall Street Journal Economic Forecast Survey“ economists surveyed averaged a 36.93% probability of a U.S. recession within the next 12 months.
_____
The Special Note summarizes my overall thoughts about our economic situation
SPX at 3360.97 as this post is written