U.S. Economic Indicators
Throughout this site there are many discussions of economic indicators. This post is the latest in a series of posts indicating U.S. economic weakness or a notably low growth rate.
The level and trend of economic growth is especially notable at this time. As seen in various measures and near-term projections, the U.S. economy is undergoing an outsized level of economic contraction. As seen in many surveys and projections, most people believe that this historic level of contraction will be temporary in nature and that an economic rebound will start in the third quarter of 2020.
As seen in the April 2020 Wall Street Journal Economic Forecast Survey the consensus (average estimate) among various economists is for -4.9% GDP growth in 2020 and 5.1% GDP growth in 2021.
Charts Indicating U.S. Economic Weakness
Below are a small sampling of charts that depict weak growth or contraction, and a brief comment for each:
The Chicago Fed National Activity Index (CFNAI)
A broad-based economic indicator that has been implying substantial contraction is the Chicago Fed National Activity Index (CFNAI).
The April 2020 Chicago Fed National Activity Index (CFNAI) updated as of April 20, 2020:
The CFNAI, with current reading of -4.19:
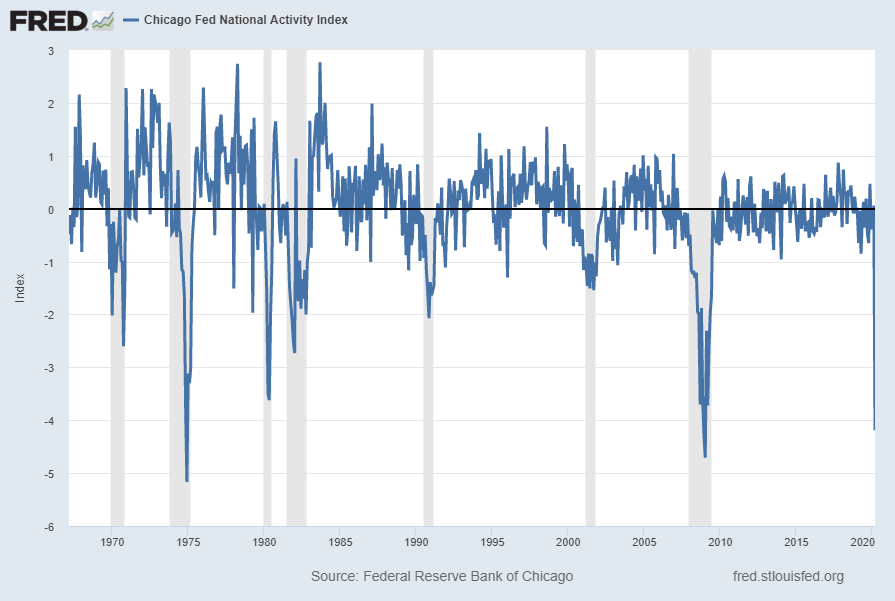
source: Federal Reserve Bank of Chicago, Chicago Fed National Activity Index [CFNAI], retrieved from FRED, Federal Reserve Bank of St. Louis, April 20, 2020;
https://fred.stlouisfed.org/series/CFNAI
The CFNAI-MA3, with current reading of -1.47:
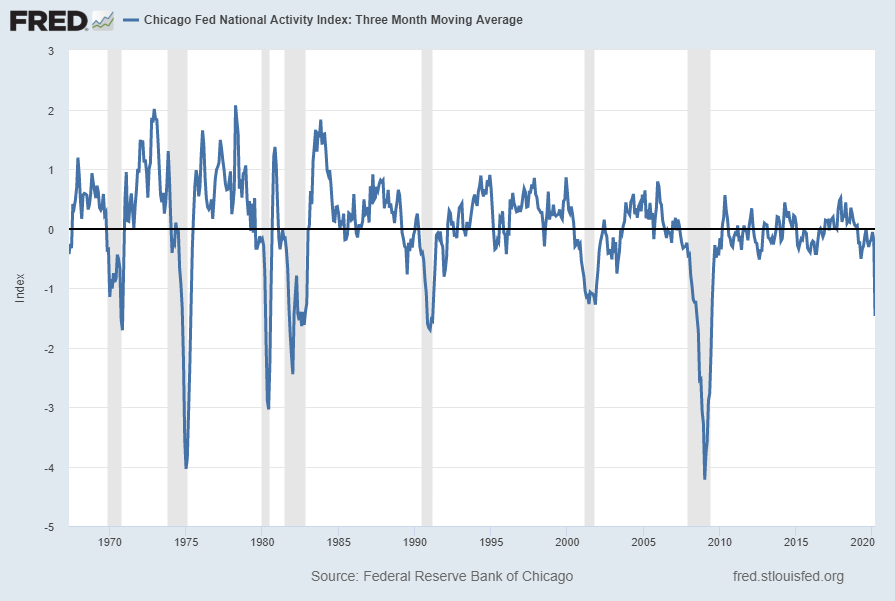
source: Federal Reserve Bank of Chicago, Chicago Fed National Activity Index: Three Month Moving Average [CFNAIMA3], retrieved from FRED, Federal Reserve Bank of St. Louis, April 20, 2020;
https://fred.stlouisfed.org/series/CFNAIMA3
__
The Aruoba-Diebold-Scotti Business Conditions Index (ADS Index)
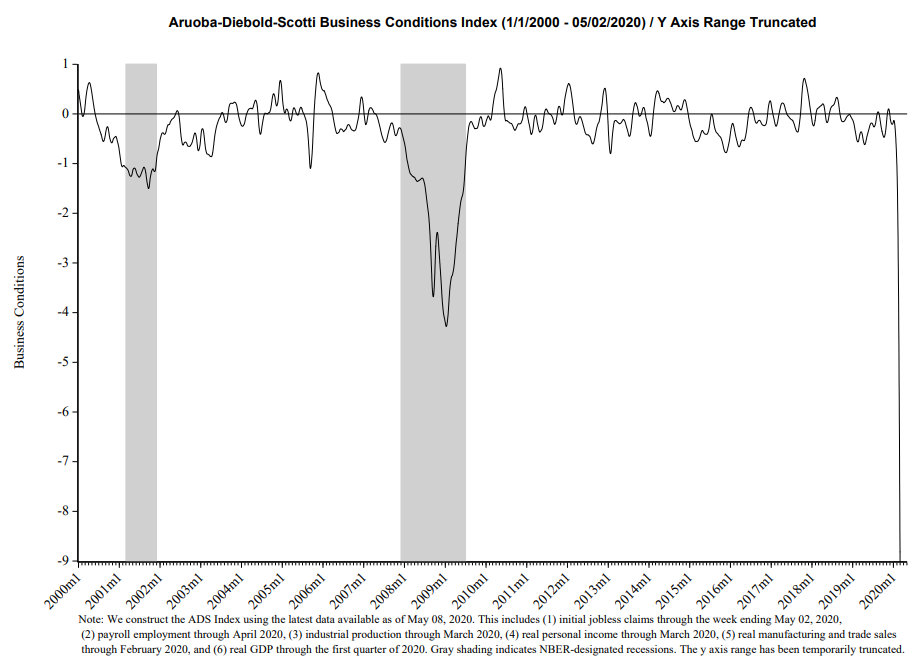
Another broad-based economic indicator that seems to imply substantial economic contraction is the Aruoba-Diebold-Scotti Business Conditions Index (ADS Index.)
Below is a chart of the index from January 1, 2000 through May 2, 2020, with a value of -36.1637, as of the May 8, 2020 update: (please note: as stated, the Y-Axis is truncated)
__
Regional Manufacturing Surveys
Various Federal Reserve regional manufacturing surveys are indicating a significant if not substantial weakening.
Below is a chart of various regional manufacturing surveys, depicted on a 3-month moving average, from Advisor Perspectives’ post of April 28, 2020 titled “April Regional Fed Manufacturing Overview“:

__
The Weekly Economic Index (WEI)
A newly-introduced indicator, the Weekly Economic Index, is an economic indicator that is a composite of 10 different weekly indicators. It is (purportedly) designed to provide a timely depiction of the U.S. economic trend. As seen below, it depicts the severity of the recent plunge in economic activity.
The Weekly Economic Index (WEI) with a value of -11.91, updated as of May 7, 2020:
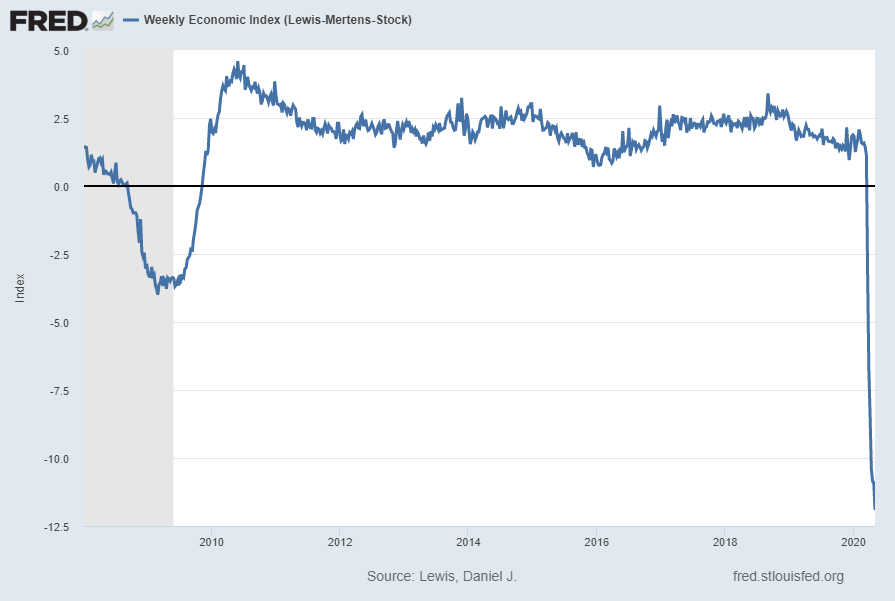
source: Lewis, Daniel J., Mertens, Karel and Stock, James H., Weekly Economic Index (Lewis-Mertens-Stock) [WEI], retrieved from FRED, Federal Reserve Bank of St. Louis, May 8, 2020; https://fred.stlouisfed.org/series/WEI
__
Oil Price Weakness
Recent (severe) oil price weakness is both an indicator of economic weakness and various imbalances. As well, substantial oil price weakness is problematical for the economy and various aspects of the financial system.
Shown below is the price of (light crude) oil on a daily basis, from 2008 through the closing price of May 8, 2020:
(click on chart to enlarge image)(chart courtesy of StockCharts.com; chart creation and annotation by the author)

__
Other Indicators
As mentioned previously, many other indicators discussed on this site indicate economic weakness or economic contraction, if not outright (gravely) problematical economic conditions.
_____
The Special Note summarizes my overall thoughts about our economic situation
SPX at 2929.80 as this post is written