U.S. Economic Indicators
Throughout this site there are many discussions of economic indicators. At this time, the readings of various indicators are especially notable. This post is the latest in a series of posts indicating U.S. economic weakness or a notably low growth rate.
While many U.S. economic indicators – including GDP – are indicating economic growth, others depict (or imply) various degrees of weak growth or economic contraction. As seen in the October 2019 Wall Street Journal Economic Forecast Survey the consensus (average estimate) among various economists is for 2.2% GDP growth in 2019 and 1.6% GDP growth in 2020. However, there are other broad-based economic indicators that seem to imply a weaker growth rate.
As well, it should be remembered that GDP figures can be (substantially) revised.
Charts Indicating U.S. Economic Weakness
Below are a small sampling of charts that depict weak growth or contraction, and a brief comment for each:
__
The Aruoba-Diebold-Scotti Business Conditions Index (ADS Index)
Various broad-based economic indicators that seem to imply a weaker growth rate than GDP.
Among the broad-based economic indicators that seem to imply subdued growth or decline is that of the Aruoba-Diebold-Scotti Business Conditions Index (ADS Index.) Below is a chart of the index from October 19, 2017 through October 19, 2019, with a value of -.1745, as of the October 24 update:
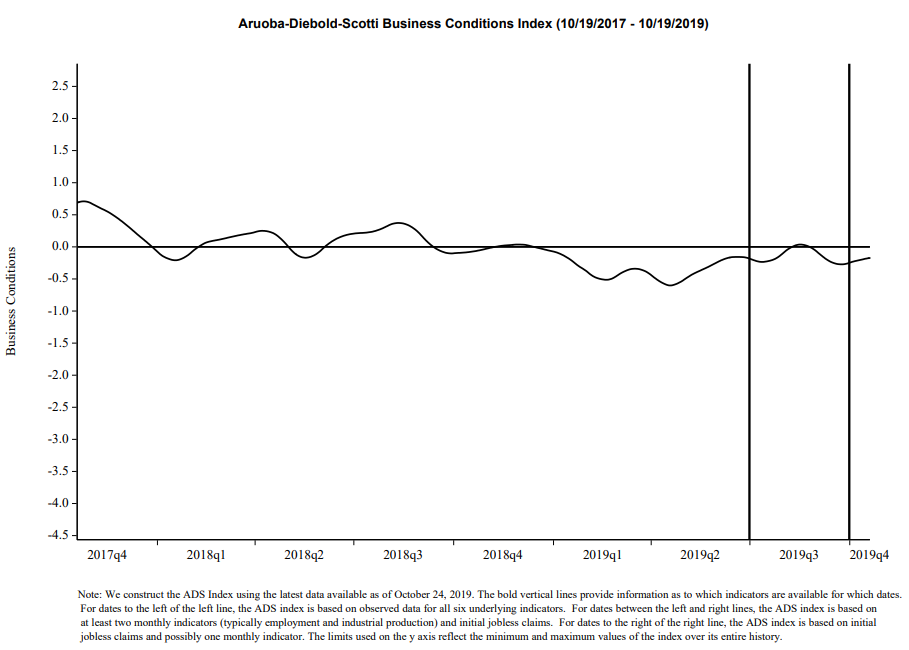
source: Federal Reserve Bank of Philadelphia, Aruoba-Diebold-Scotti Business Conditions Index (ADS Index)
__
Total Construction Spending: Commercial
Various measures of construction spending continue to exhibit weakness. “Total Construction Spending: Commercial” is a measure of construction exhibiting a contraction on a “Percent Change From Year Ago” basis. This measure through August had a last value of $80,247 Million. Shown below is the measure displayed on a “Percent Change From Year Ago” basis with a value of -11.6%, last updated October 1, 2019:
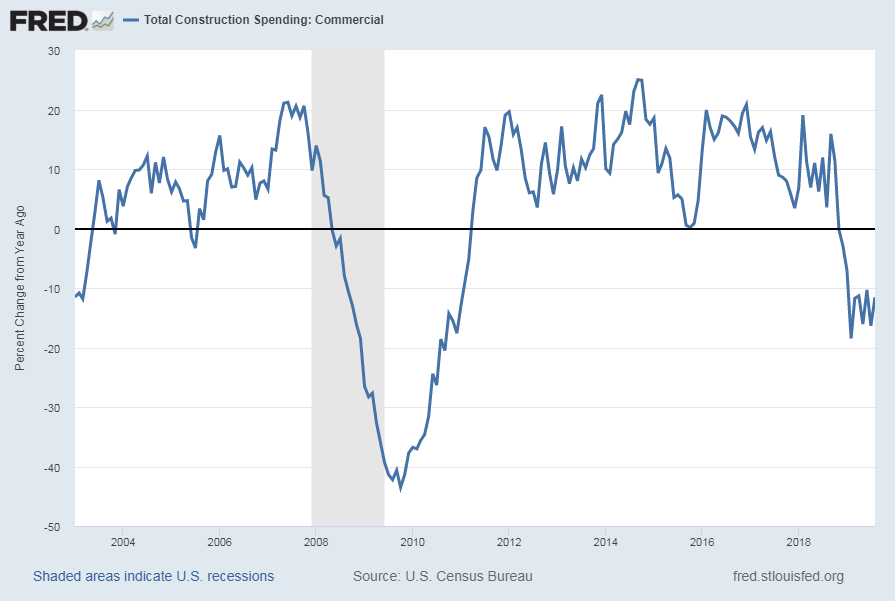
source: U.S. Bureau of the Census, Total Construction Spending: Commercial [TLCOMCONS], retrieved from FRED, Federal Reserve Bank of St. Louis, accessed October 8, 2019: https://fred.stlouisfed.org/series/TLCOMCONS
__
Value of Manufacturers’ New Orders for Consumer Goods Industries (ACOGNO)
A measure for consumer goods exhibiting a weakening (on a YoY basis) growth trend is the “Value of Manufacturers’ New Orders for Consumer Goods Industries” (ACOGNO). Shown below is this measure (with last value of $212,301 Million through August) displayed on a “Percent Change From Year Ago” basis with value -.3%, last updated October 3, 2019:
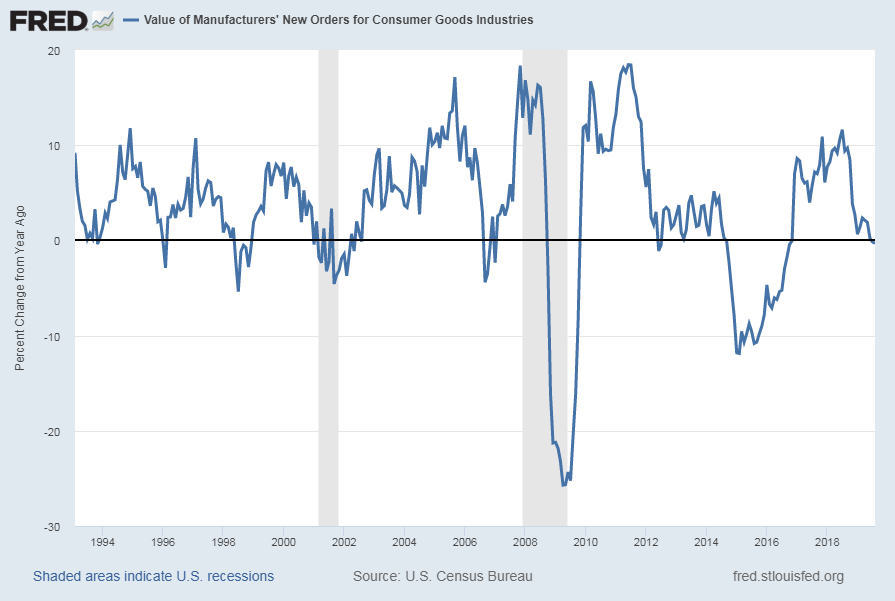
source: U.S. Census Bureau, Value of Manufacturers’ New Orders for Consumer Goods Industries [ACOGNO], retrieved from FRED, Federal Reserve Bank of St. Louis; accessed October 8, 2019: https://fred.stlouisfed.org/series/ACOGNO
__
Average Weekly Overtime Hours of Production and Nonsupervisory Employees: Manufacturing (AWOTMAN)
Various U.S. manufacturing measures continue to indicate either a significant weakening in growth or a decline in various aspects of activity. Another indication of weakening manufacturing activity is overtime hours. Shown below is the “Average Weekly Overtime Hours of Production and Nonsupervisory Employees: Manufacturing” measure (with last value of 4.2 hours through August) displayed on a “Percent Change From Year Ago” basis with value -6.7%, last updated October 4, 2019:
![Average Weekly Overtime Hours of Production and Nonsupervisory Employees: Manufacturing [AWOTMAN] Percent Change From A Year Ago](https://www.economicgreenfield.com/wp-content/uploads/2019/10/AWOTMAN_10-4-19-4.2-hours-6.7-Percent-Change-From-Year-Ago.png)
source: U.S. Bureau of Labor Statistics, Average Weekly Overtime Hours of Production and Nonsupervisory Employees: Manufacturing [AWOTMAN], retrieved from FRED, Federal Reserve Bank of St. Louis; accessed October 8, 2019: https://fred.stlouisfed.org/series/AWOTMAN
__
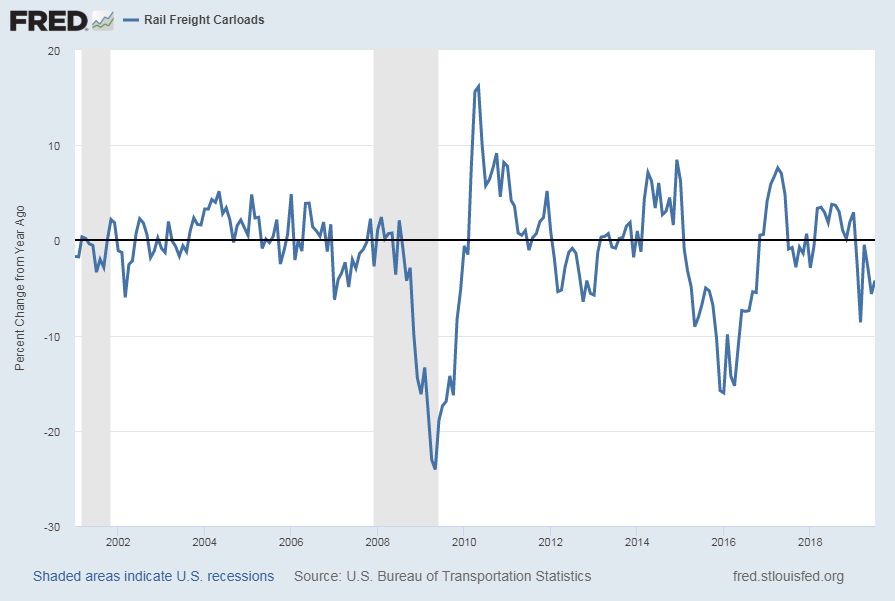
Rail Freight Carloads
“Rail Freight Carloads” continues to show a generally downward progression from a longer-term perspective. Shown below is a chart with data through July (last value of 1,094,904 updated September 23, 2019):
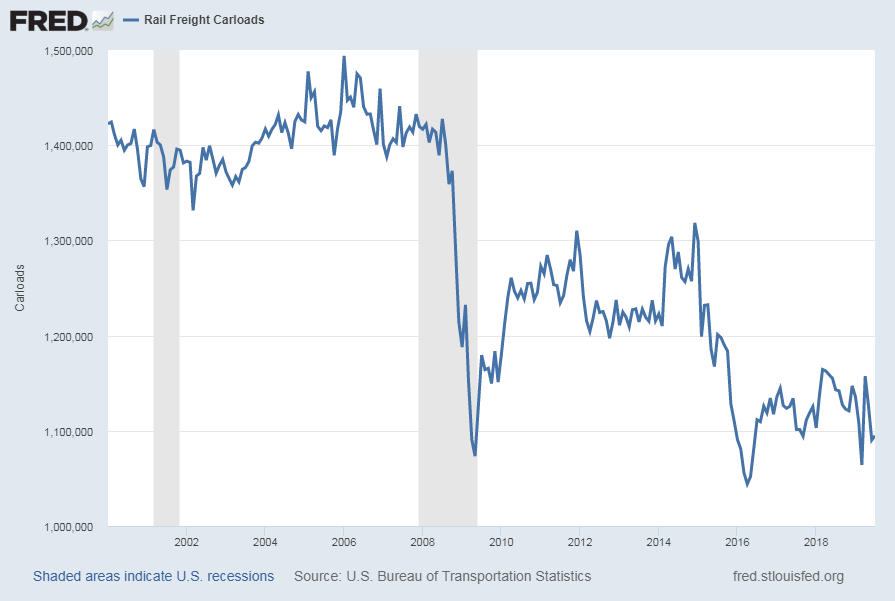
source: U.S. Bureau of Transportation Statistics, Rail Freight Carloads [RAILFRTCARLOADSD11], retrieved from FRED, Federal Reserve Bank of St. Louis; accessed October 9, 2019: https://fred.stlouisfed.org/series/RAILFRTCARLOADSD11
Here is the same measure on a “Percent Change From Year Ago” basis, with value -4.2%:
__
Other Indicators
As mentioned previously, many other indicators discussed on this site indicate economic weakness or economic contraction, if not outright (gravely) problematical economic conditions.
_____
The Special Note summarizes my overall thoughts about our economic situation
SPX at 3010.29 as this post is written