U.S. Economic Indicators
Throughout this site there are many discussions of economic indicators. At this time, the readings of various indicators are especially notable. This post is the latest in a series of posts indicating U.S. economic weakness or a notably low growth rate.
While many U.S. economic indicators – including GDP – are indicating economic growth, others depict (or imply) various degrees of weak growth or economic contraction. As seen in the May 2019 Wall Street Journal Economic Forecast Survey the consensus (average estimate) among various economists is for 2.3% GDP growth in 2019 and 1.8% GDP growth in 2020. However, there are other broad-based economic indicators that seem to imply a weaker growth rate.
As well, it should be remembered that GDP figures can be (substantially) revised.
Charts Indicating U.S. Economic Weakness
Below are a small sampling of charts that depict weak growth or contraction, and a brief comment for each:
Total Federal Receipts
“Total Federal Receipts” growth continues to be intermittent in nature since 2015. As well, the level of growth does not seem congruent to the (recent) levels of economic growth as seen in aggregate measures such as Real GDP.
“Total Federal Receipts” through May had a last monthly value of $232,064 Million. Shown below is the measure displayed on a “Percent Change From Year Ago” basis with value 6.9%, last updated June 12, 2019:
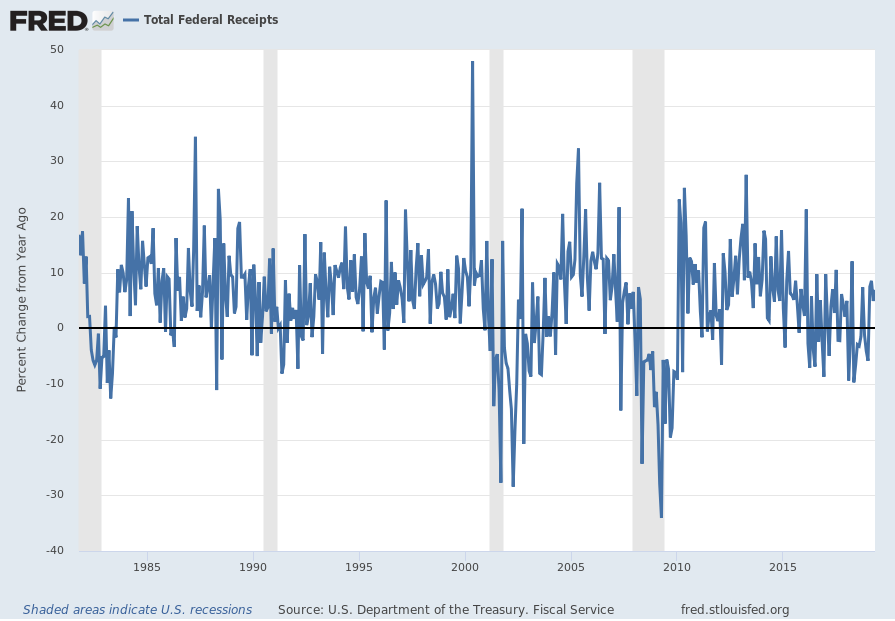
source: U.S. Department of the Treasury. Fiscal Service, Total Federal Receipts [MTSR133FMS], retrieved from FRED, Federal Reserve Bank of St. Louis; accessed June 12, 2019:
https://fred.stlouisfed.org/series/MTSR133FMS
__
The Aruoba-Diebold-Scotti Business Conditions Index (ADS Index)
While the 1st quarter GDP (second estimate) was 3.1%, there are other broad-based economic indicators that seem to imply a weaker recent growth rate.
Among the broad-based economic indicators that seem to imply subdued growth or decline is that of the Aruoba-Diebold-Scotti Business Conditions Index (ADS Index.) Below is a chart of the index from June 8, 2017 through June 8, 2019, with a value of -.3142, as of the June 13 update:
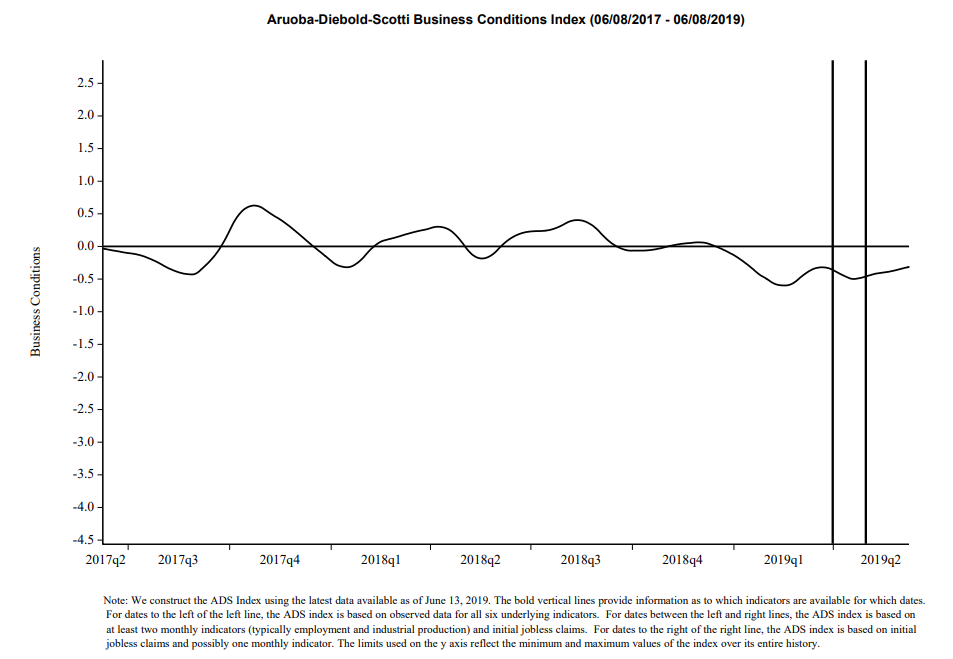
source: Federal Reserve Bank of Philadelphia, Aruoba-Diebold-Scotti Business Conditions Index (ADS Index)
__
The Yield Curve
Many people believe that the Yield Curve is a leading economic indicator for the United States economy.
On March 1, 2010, I wrote a post on the issue, titled “The Yield Curve As A Leading Economic Indicator.”
While I continue to have the stated reservations regarding the “Yield Curve” as an indicator, I do believe that it should be monitored.
Various portions of the U.S. Yield Curve have been showing intermittent or prolonged inversions. Below is the spread between 10-Year Treasury Constant Maturity and the 3-Month Treasury Constant Maturity from 1982 through the June 11, 2019 value, currently showing a value of -.12: (10-Year Treasury Yield of 2.15%, 3-Month Treasury Yield of 2.27%)
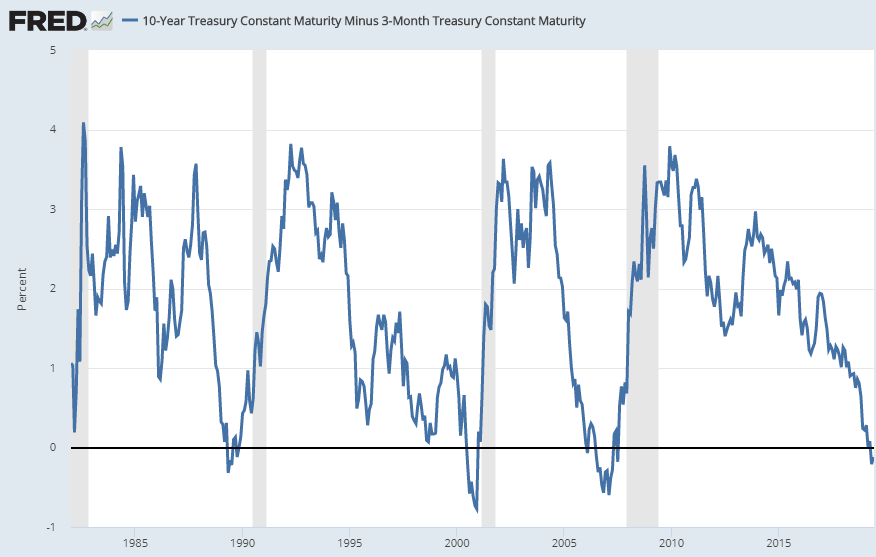
source: Federal Reserve Bank of St. Louis, 10-Year Treasury Constant Maturity Minus 3-Month Treasury Constant Maturity [T10Y3M], retrieved from FRED, Federal Reserve Bank of St. Louis; accessed June 12, 2019: https://fred.stlouisfed.org/series/T10Y3M
__
Unemployment
I have written extensively concerning unemployment, as the current and future unemployment issue is of tremendous importance.
The consensus belief is that employment remains robust, citing total nonfarm payroll growth and the current unemployment rate of 3.6%. However, my analyses continue to indicate that the conclusion that employment is strong is incorrect. While the unemployment rate indicates that unemployment is (very) low, closer examination indicates that this metric is, for a number of reasons, highly misleading.
My analyses indicate that the underlying dynamics of the unemployment situation remain exceedingly worrisome, especially with regard to the future. These dynamics are numerous and complex, and greatly lack recognition and understanding, especially as how from an “all-things-considered” standpoint they will evolve in an economic and societal manner. I have discussed the overall current and future U.S. employment situation on the “U.S. Employment Trends” page.
While there are many charts that can be shown, one that depicts a worrisome trend is the Civilian Labor Force Participation Rate for those with a Bachelor’s Degree and Higher, 25 years and over. Among disconcerting aspects of this measure is the long-term (most notably the post-2009) trend, especially given this demographic segment.
The current value as of the June 7, 2018 update (reflecting data through the May employment report) is 73.8%:
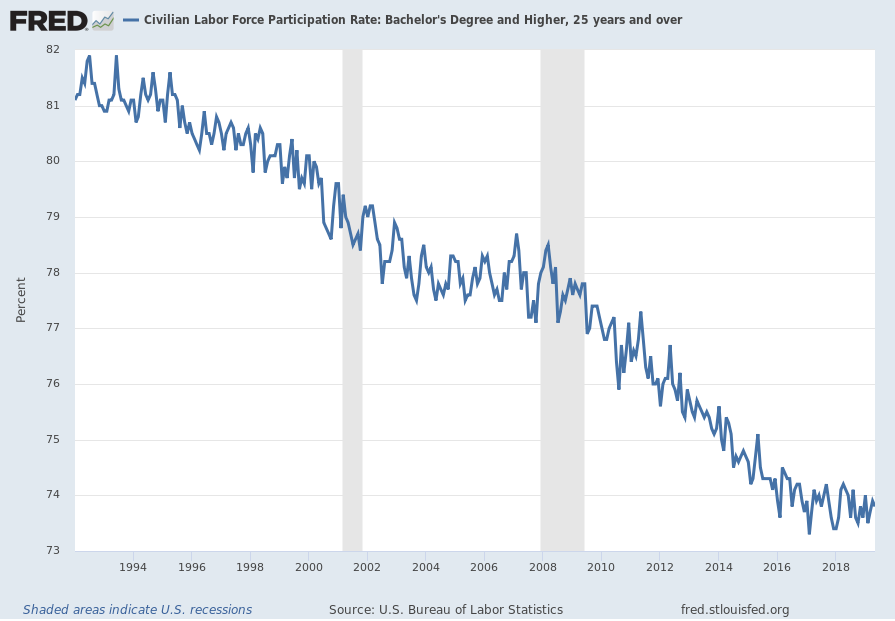
source: U.S. Bureau of Labor Statistics, Civilian Labor Force Participation Rate: Bachelor’s Degree and Higher, 25 years and over [LNS11327662], retrieved from FRED, Federal Reserve Bank of St. Louis; accessed June 12, 2019: https://fred.stlouisfed.org/series/LNS11327662
__
Total Private Construction Spending: Residential
Various measures of construction continue to exhibit weakness. “Total Private Construction Spending: Residential” is one measure of construction exhibiting a contraction on a “Percent Change From Year Ago” basis. This measure through April had a last value of $499,320 Million (SAAR). Shown below is the measure displayed on a “Percent Change From Year Ago” basis with a value of -11.4%, last updated June 3, 2019:
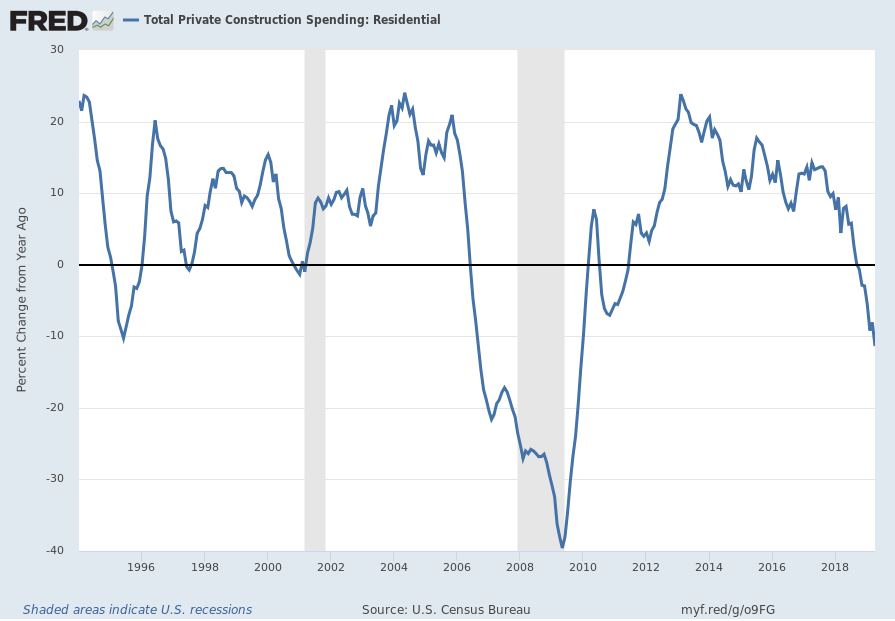
source: U.S. Census Bureau, Total Private Construction Spending: Residential [PRRESCONS], retrieved from FRED, Federal Reserve Bank of St. Louis; accessed June 10, 2019: https://fred.stlouisfed.org/series/PRRESCONS
__
Other Indicators
As mentioned previously, many other indicators discussed on this site indicate economic weakness or economic contraction, if not outright (gravely) problematical economic conditions.
_____
The Special Note summarizes my overall thoughts about our economic situation
SPX at 2888.12 as this post is written