U.S. Economic Indicators
Throughout this site there are many discussions of economic indicators. At this time, the readings of various indicators are especially notable. This post is the latest in a series of posts indicating U.S. economic weakness or a notably low growth rate.
While many U.S. economic indicators – including GDP – are indicating economic growth, others depict (or imply) various degrees of weak growth or economic contraction. As seen in the May 2019 Wall Street Journal Economic Forecast Survey the consensus (average estimate) among various economists is for 2.3% GDP growth in 2019 and 1.8% GDP growth in 2020. However, there are other broad-based economic indicators that seem to imply a weaker growth rate.
As well, it should be remembered that GDP figures can be (substantially) revised.
Charts Indicating U.S. Economic Weakness
Below are a small sampling of charts that depict weak growth or contraction, and a brief comment for each:
Total Federal Receipts
“Total Federal Receipts” growth continues to be intermittent in nature since 2015. As well, the level of growth does not seem congruent to the (recent) levels of economic growth as seen in aggregate measures such as Real GDP.
“Total Federal Receipts” through April had a last value of $535,545 Million. Shown below is the measure displayed on a “Percent Change From Year Ago” basis with value 4.9%, last updated May 10, 2019:
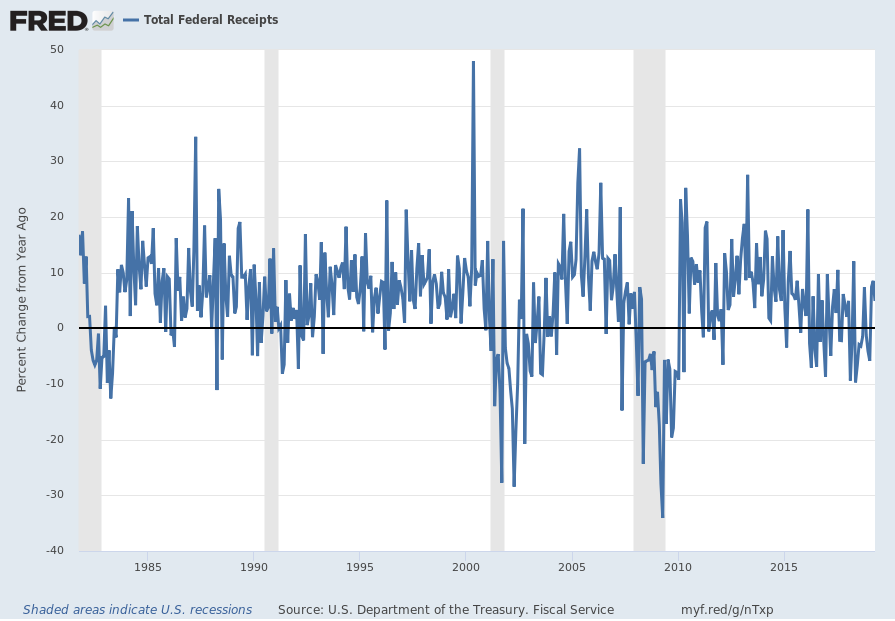
source: U.S. Department of the Treasury. Fiscal Service, Total Federal Receipts [MTSR133FMS], retrieved from FRED, Federal Reserve Bank of St. Louis; accessed May 13, 2019:
https://fred.stlouisfed.org/series/MTSR133FMS
__
Vehicle Miles Traveled
I continue to find the flagging growth trend in the “Vehicle Miles Traveled” (NSA) measure since 2015 to be notable.
“Vehicle Miles Traveled” through February had a last value of 225,541 Million. Shown below is the measure displayed on a “Percent Change From Year Ago” basis with value -.4%, last updated April 30, 2019:
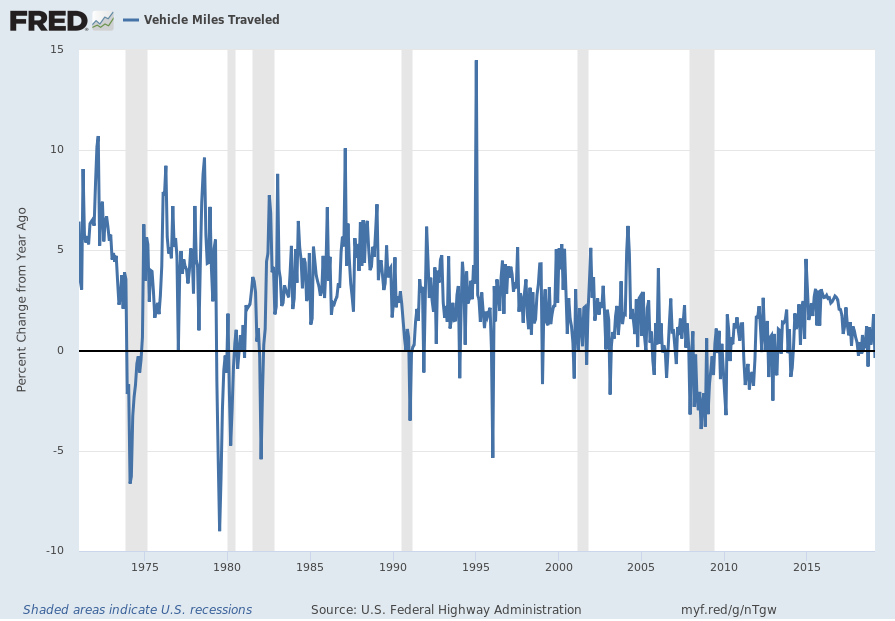
source: U.S. Federal Highway Administration, Vehicle Miles Traveled [TRFVOLUSM227NFWA], retrieved from FRED, Federal Reserve Bank of St. Louis; accessed May 10, 2019: https://fred.stlouisfed.org/series/TRFVOLUSM227NFWA
__
Value of Manufacturers’ New Orders for Consumer Goods: Durable Goods Excluding Defense Industries
Various aspects of manufacturing have been showing weaker growth or mild decline. Among the measures depicting these trends is the “Value of Manufacturers’ New Orders for Consumer Goods: Durable Goods Excluding Defense Industries.” Shown below is the measure (with last value of $241,257 Million through March) displayed on a “Percent Change From Year Ago” basis with value .5%, last updated May 2, 2019:

source: U.S. Census Bureau, Value of Manufacturers’ New Orders for Consumer Goods: Durable Goods Excluding Defense Industries [ADXDNO], retrieved from FRED, Federal Reserve Bank of St. Louis; accessed May 7, 2019: https://fred.stlouisfed.org/series/ADXDNO
__
Average Weekly Overtime Hours of Production and Nonsupervisory Employees: Manufacturing (AWOTMAN)
Another indication of weakening manufacturing activity is overtime hours. Shown below is the “Average Weekly Overtime Hours of Production and Nonsupervisory Employees: Manufacturing” measure displayed on a “Percent Change From Year Ago” basis with value -8.5%, last updated May 3, 2019:
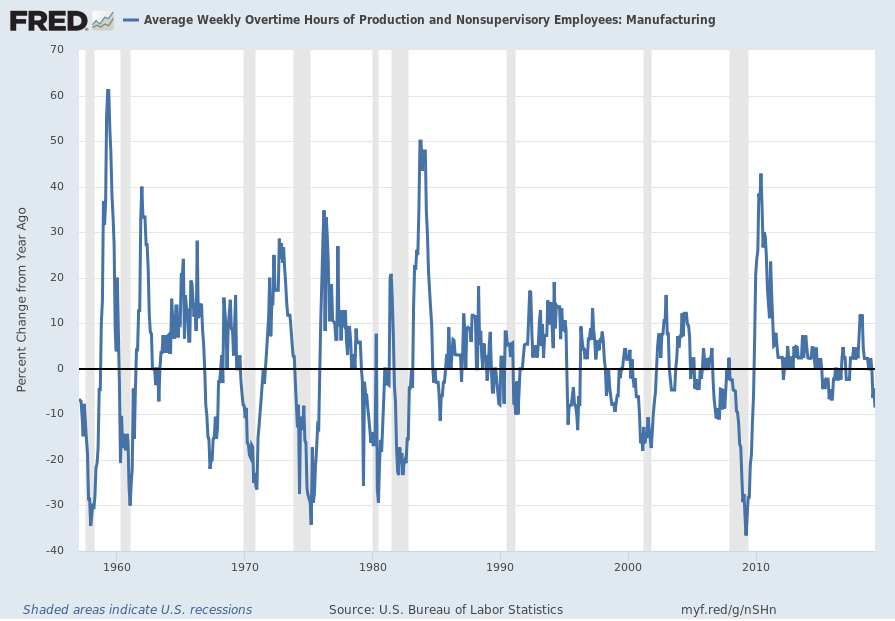
source: U.S. Bureau of Labor Statistics, Average Weekly Overtime Hours of Production and Nonsupervisory Employees: Manufacturing [AWOTMAN], retrieved from FRED, Federal Reserve Bank of St. Louis; accessed May 9, 2019:
https://fred.stlouisfed.org/series/AWOTMAN
__
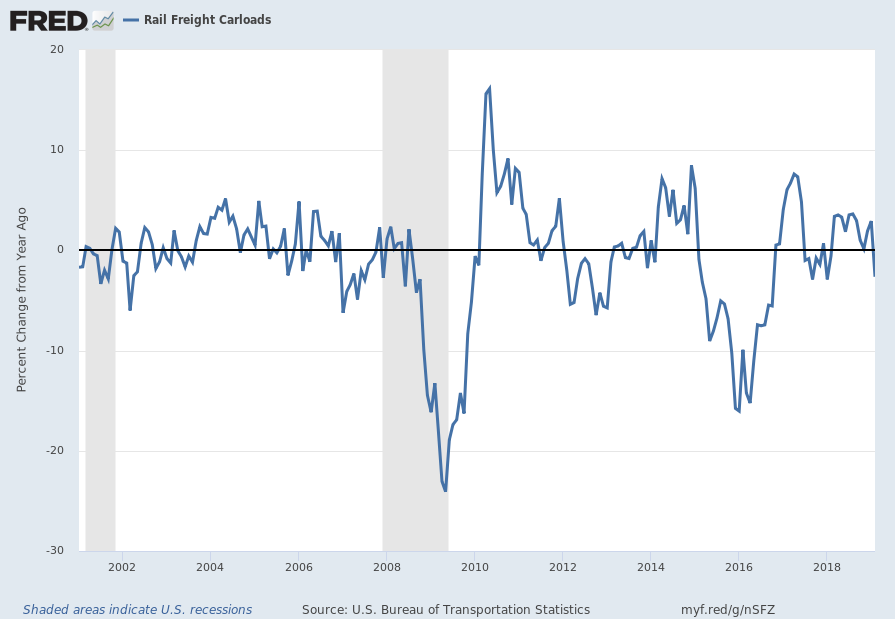
Rail Freight Carloads
“Rail Freight Carloads” continues to show a generally downward progression. Shown below is a chart with data through February (last value of 1,110,930, updated April 25, 2019):
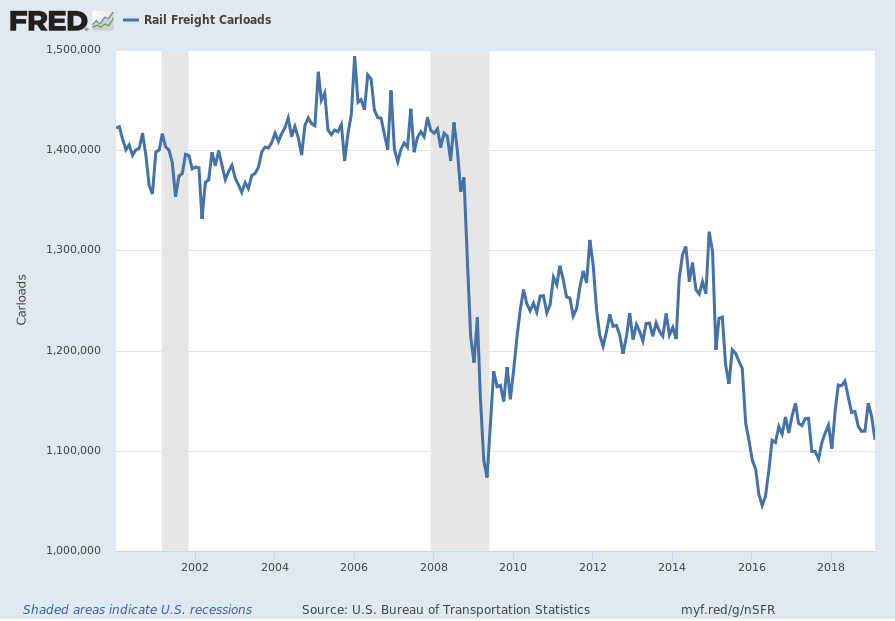
source: U.S. Bureau of Transportation Statistics, Rail Freight Carloads [RAILFRTCARLOADSD11], retrieved from FRED, Federal Reserve Bank of St. Louis; accessed May 9,2019: https://fred.stlouisfed.org/series/RAILFRTCARLOADSD11
Here is the same measure on a “Percent Change From Year Ago” basis, with value -2.6%:
__
U.S. Population Growth
Shown below is a long-term chart of population growth data through December (last value of 330.309 Million) on a “Percent Change From A Year Ago” basis with value .6%. The declining nature of the growth rate is notable and may in itself deserve consideration as an economic indicator:
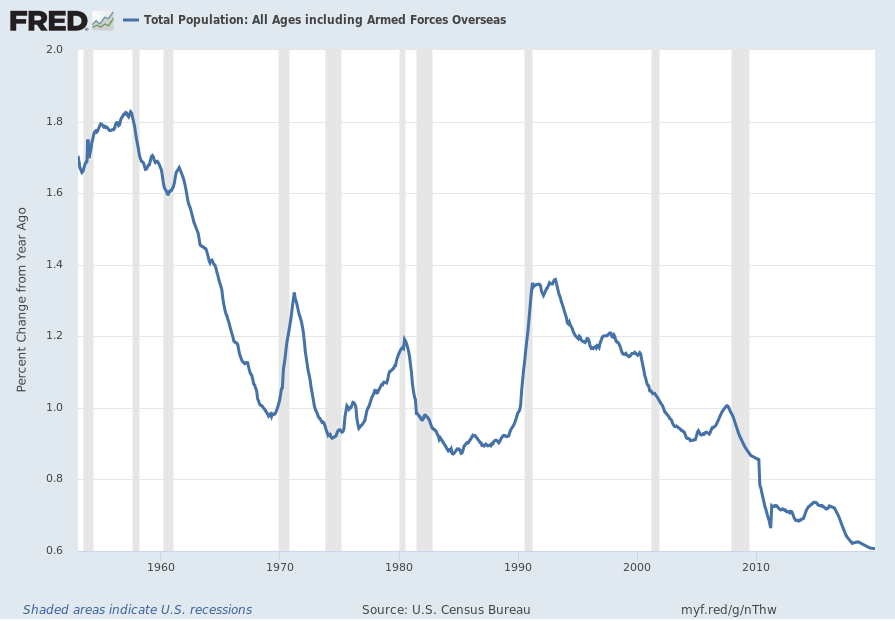
source: U.S. Bureau of the Census, Total Population: All Ages including Armed Forces Overseas [POP], retrieved from FRED, Federal Reserve Bank of St. Louis December 10, 2017:
https://fred.stlouisfed.org/series/POP
__
Other Indicators
As mentioned previously, many other indicators discussed on this site indicate economic weakness or economic contraction, if not outright (gravely) problematical economic conditions.
_____
The Special Note summarizes my overall thoughts about our economic situation
SPX at 2881.40 as this post is written