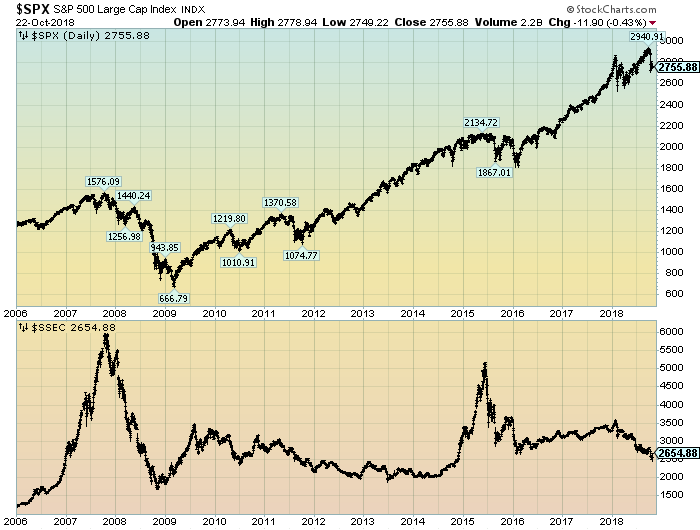
For reference purposes, the chart below shows the S&P500 vs. the Shanghai Stock Exchange Composite Index on a daily basis, since 2006, with price labels:
(click on chart to enlarge image)(chart courtesy of StockCharts.com; chart creation and annotation by the author)
_____
The Special Note summarizes my overall thoughts about our economic situation
SPX at 2755.88 as this post is written
