Today’s (March 28, 2018) GDP release (Q4, 3rd Estimate)(pdf) was accompanied by the BLS Corporate Profits report for the 4th Quarter.
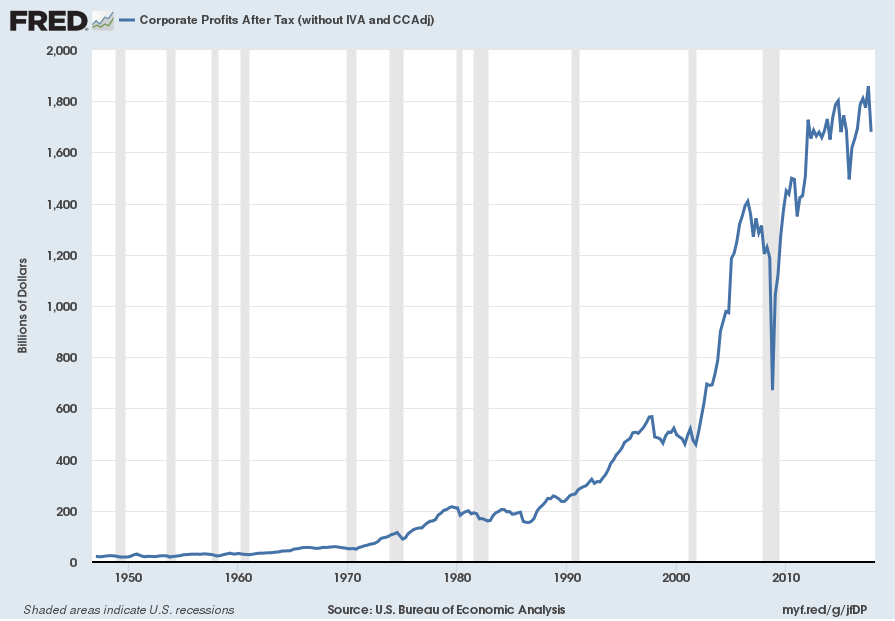
Of course, there are many ways to adjust and depict overall Corporate Profits. For reference purposes, here is a chart from the St. Louis Federal Reserve (FRED) showing the Corporate Profits After Tax (without IVA and CCAdj) (last updated March 28, 2018, with a value of $1680.25 Billion SAAR):
–
Here is the Corporate Profits After Tax measure shown on a Percentage Change from a Year Ago perspective:
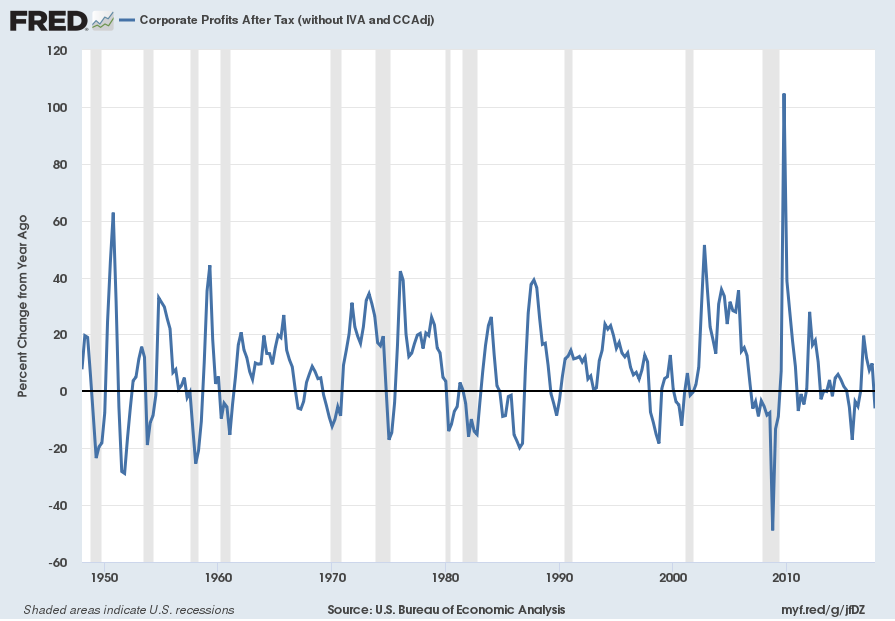
Data Source: FRED, Federal Reserve Economic Data, Federal Reserve Bank of St. Louis: Corporate Profits After Tax [CP]; U.S. Department of Commerce: Bureau of Economic Analysis; accessed March 28, 2018; https://research.stlouisfed.org/fred2/series/CP
_________
I post various indicators and indices because I believe they should be carefully monitored. However, as those familiar with this site are aware, I do not necessarily agree with what they depict or imply.
_____
The Special Note summarizes my overall thoughts about our economic situation
SPX at 2615.85 as this post is written