On September 5, 2017 Gallup released the poll results titled “U.S. Economic Confidence Surges, Then Declines, in August.”
Notable excerpts include:
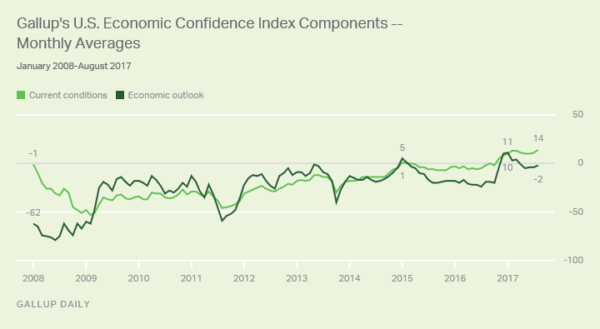
Gallup’s U.S. Economic Confidence Index is the average of two components: how Americans rate current economic conditions and whether they believe the economy is improving or getting worse. The index has a theoretical maximum of +100 if all Americans were to say the economy is doing well and improving, and a theoretical minimum of -100 if all were to say the economy is doing poorly and getting worse.
Last month, 35% of Americans described current economic conditions as “excellent” or “good,” while 21% assessed them as “poor.” Overall, the current conditions component of Gallup’s U.S. Economic Confidence Index stood at +14 for the month, slightly better than July’s +11 and the highest monthly average for this component since 2008.
Slightly more Americans, meanwhile, continued to say the economy was “getting worse” (48%) than “getting better” (46%) in August. This leaves the economic outlook component at -2 for the month, essentially no different from its performance in July (-4).
Here is an accompanying chart of the two components of the Gallup Economic Confidence Index, discussed above:
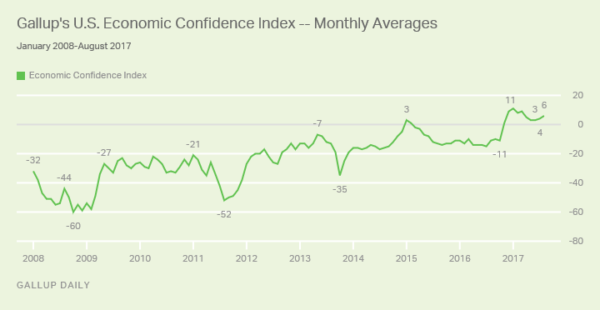
Here is an accompanying chart of the Gallup Economic Confidence Index:
_____
The Special Note summarizes my overall thoughts about our economic situation
SPX at 2457.85 as this post is written