Shortly after each monthly employment report I have been posting a continual series titled “3 Critical Unemployment Charts.”
Of course, there are many other employment charts that can be displayed as well.
For reference purposes, below are the U-3 and U-6 Unemployment Rate charts from a long-term historical perspective. Both charts are from the St. Louis Fed site. The U-3 measure is what is commonly referred to as the official unemployment rate; whereas the U-6 rate is officially (per Bureau of Labor Statistics) defined as:
Total unemployed, plus all persons marginally attached to the labor force, plus total employed part time for economic reasons, as a percent of the civilian labor force plus all persons marginally attached to the labor force
Of note, many economic observers use the U-6 rate as a (closer) proxy of the actual unemployment rate rather than that depicted by the U-3 measure.
Here is the U-3 chart, currently showing a 6.1% unemployment rate:
(click on charts to enlarge images)(charts updated as of 7-3-14)
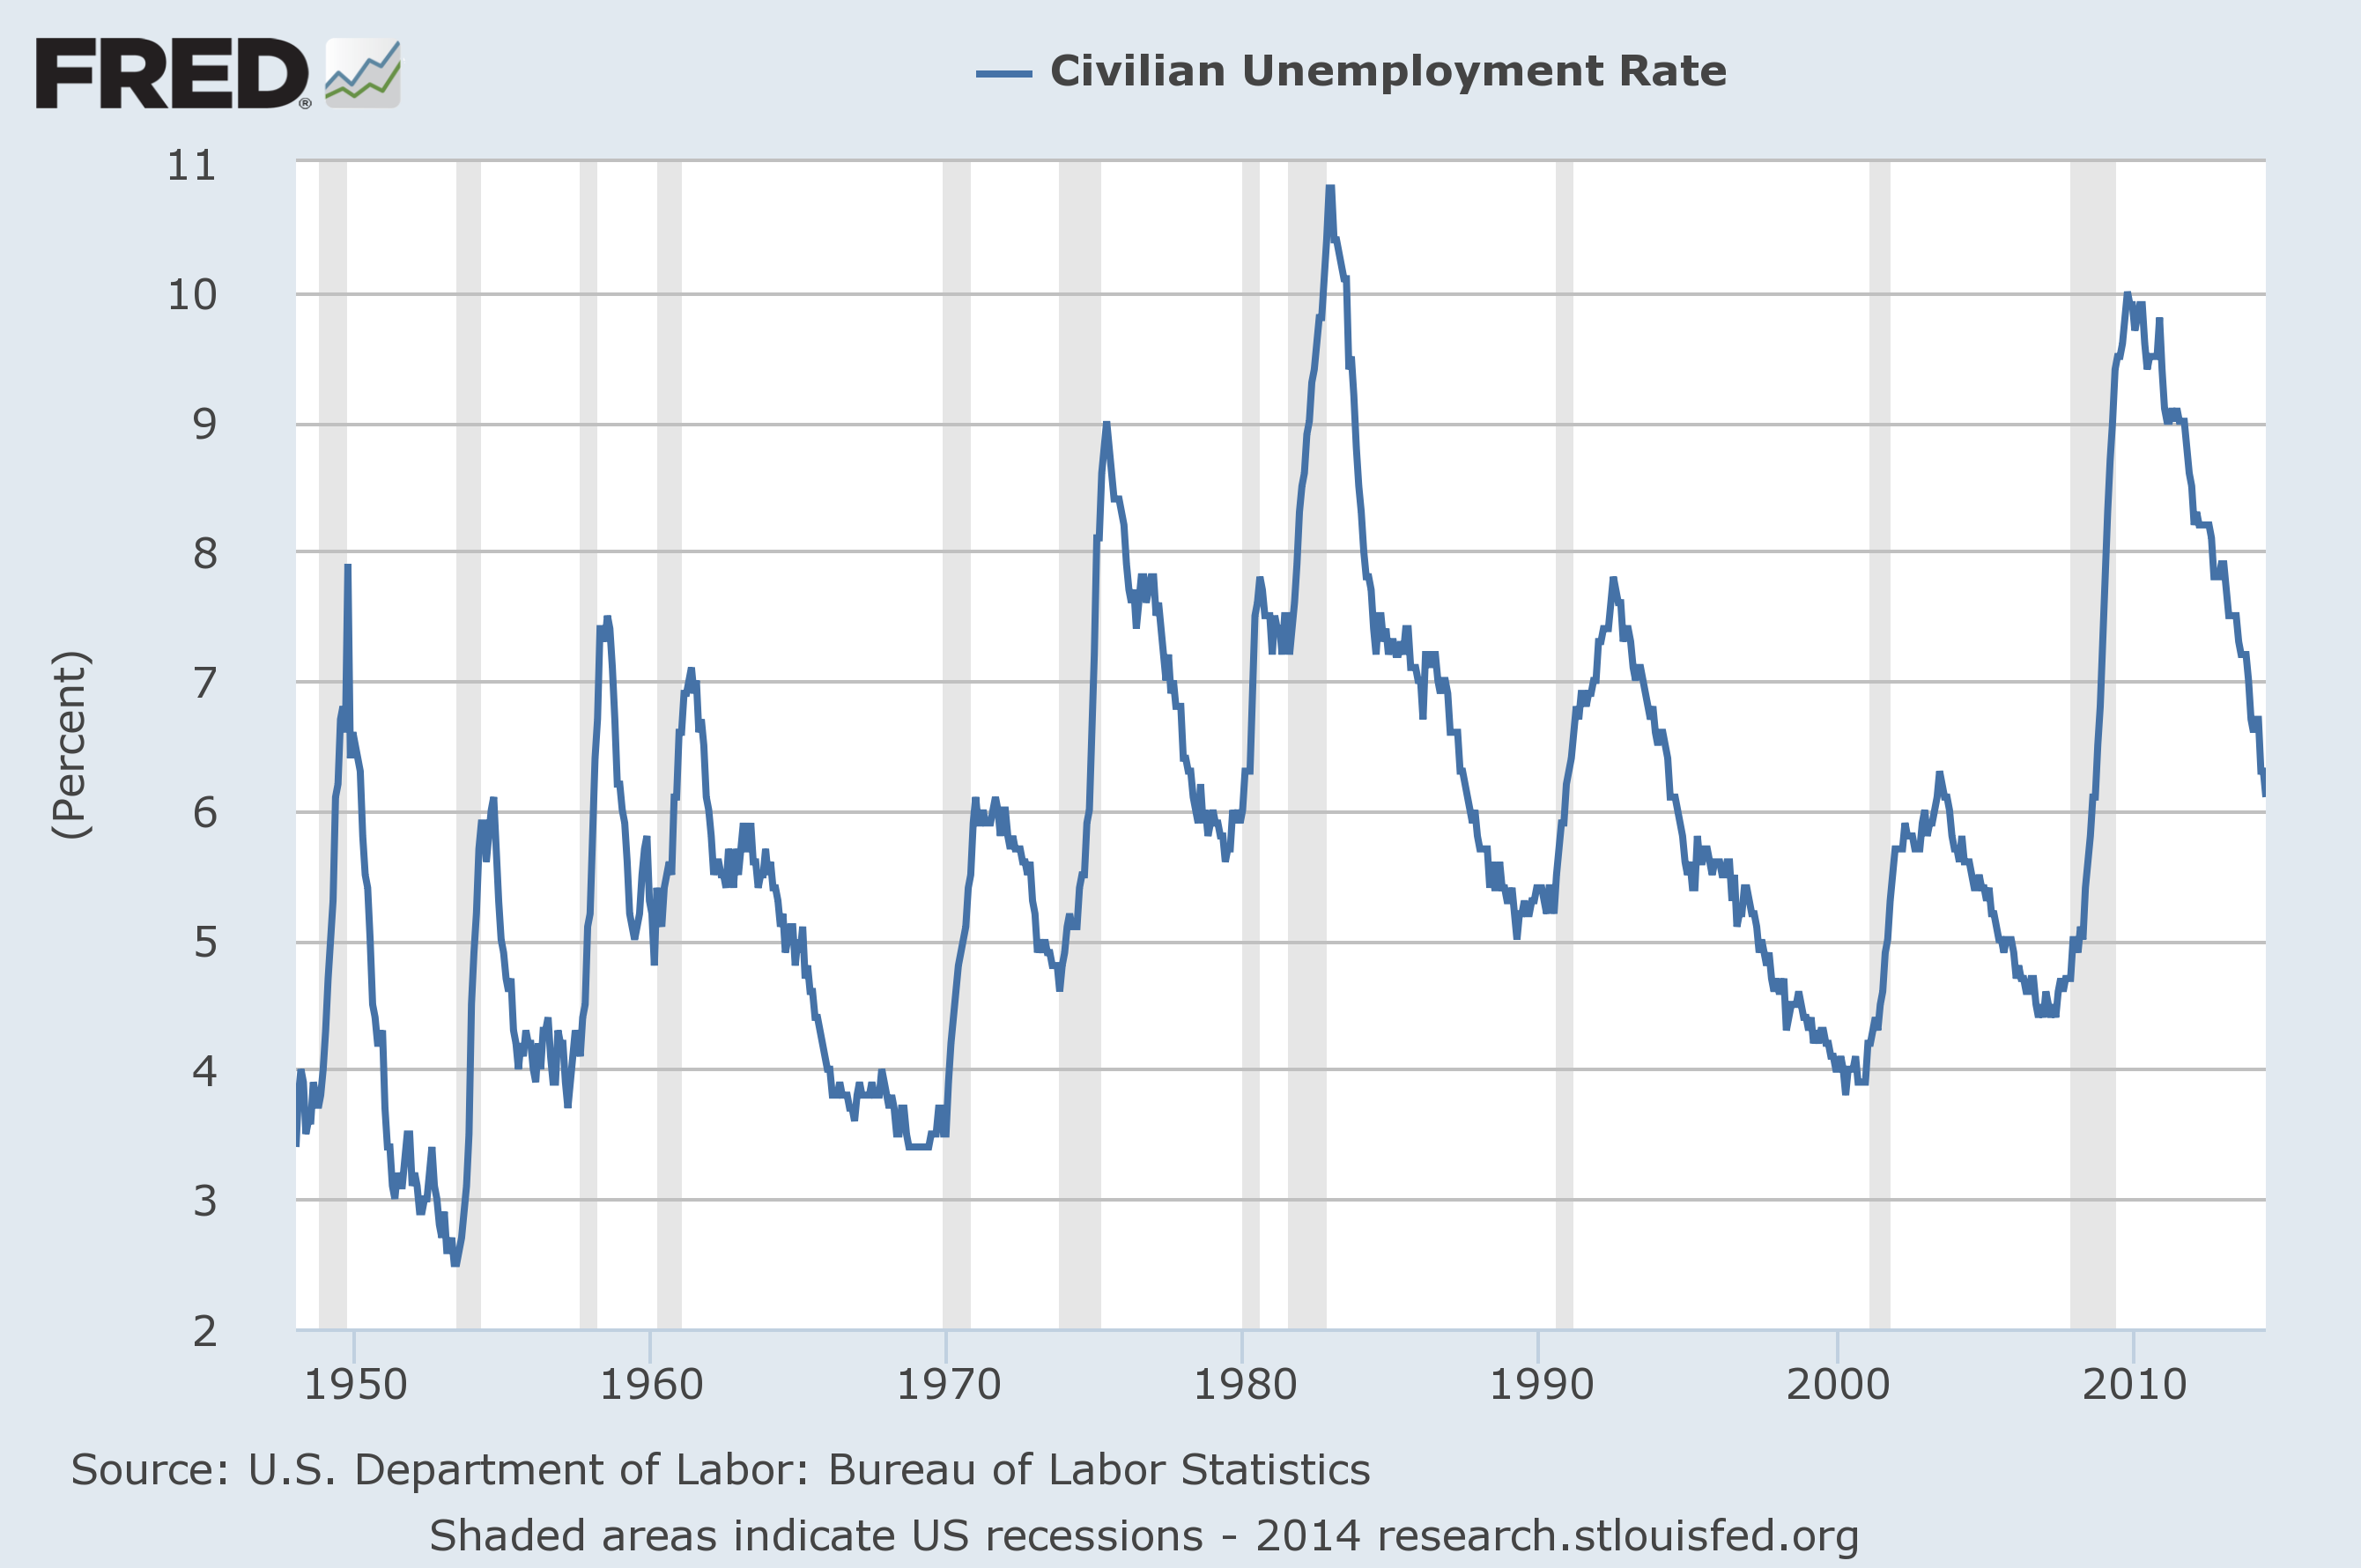
Data Source: FRED, Federal Reserve Economic Data, Federal Reserve Bank of St. Louis: Civilian Unemployment Rate [UNRATE] ; U.S. Department of Labor: Bureau of Labor Statistics; accessed July 3, 2014;
http://research.stlouisfed.org/fred2/series/UNRATE
–
Here is the U-6 chart, currently showing a 12.1% unemployment rate:
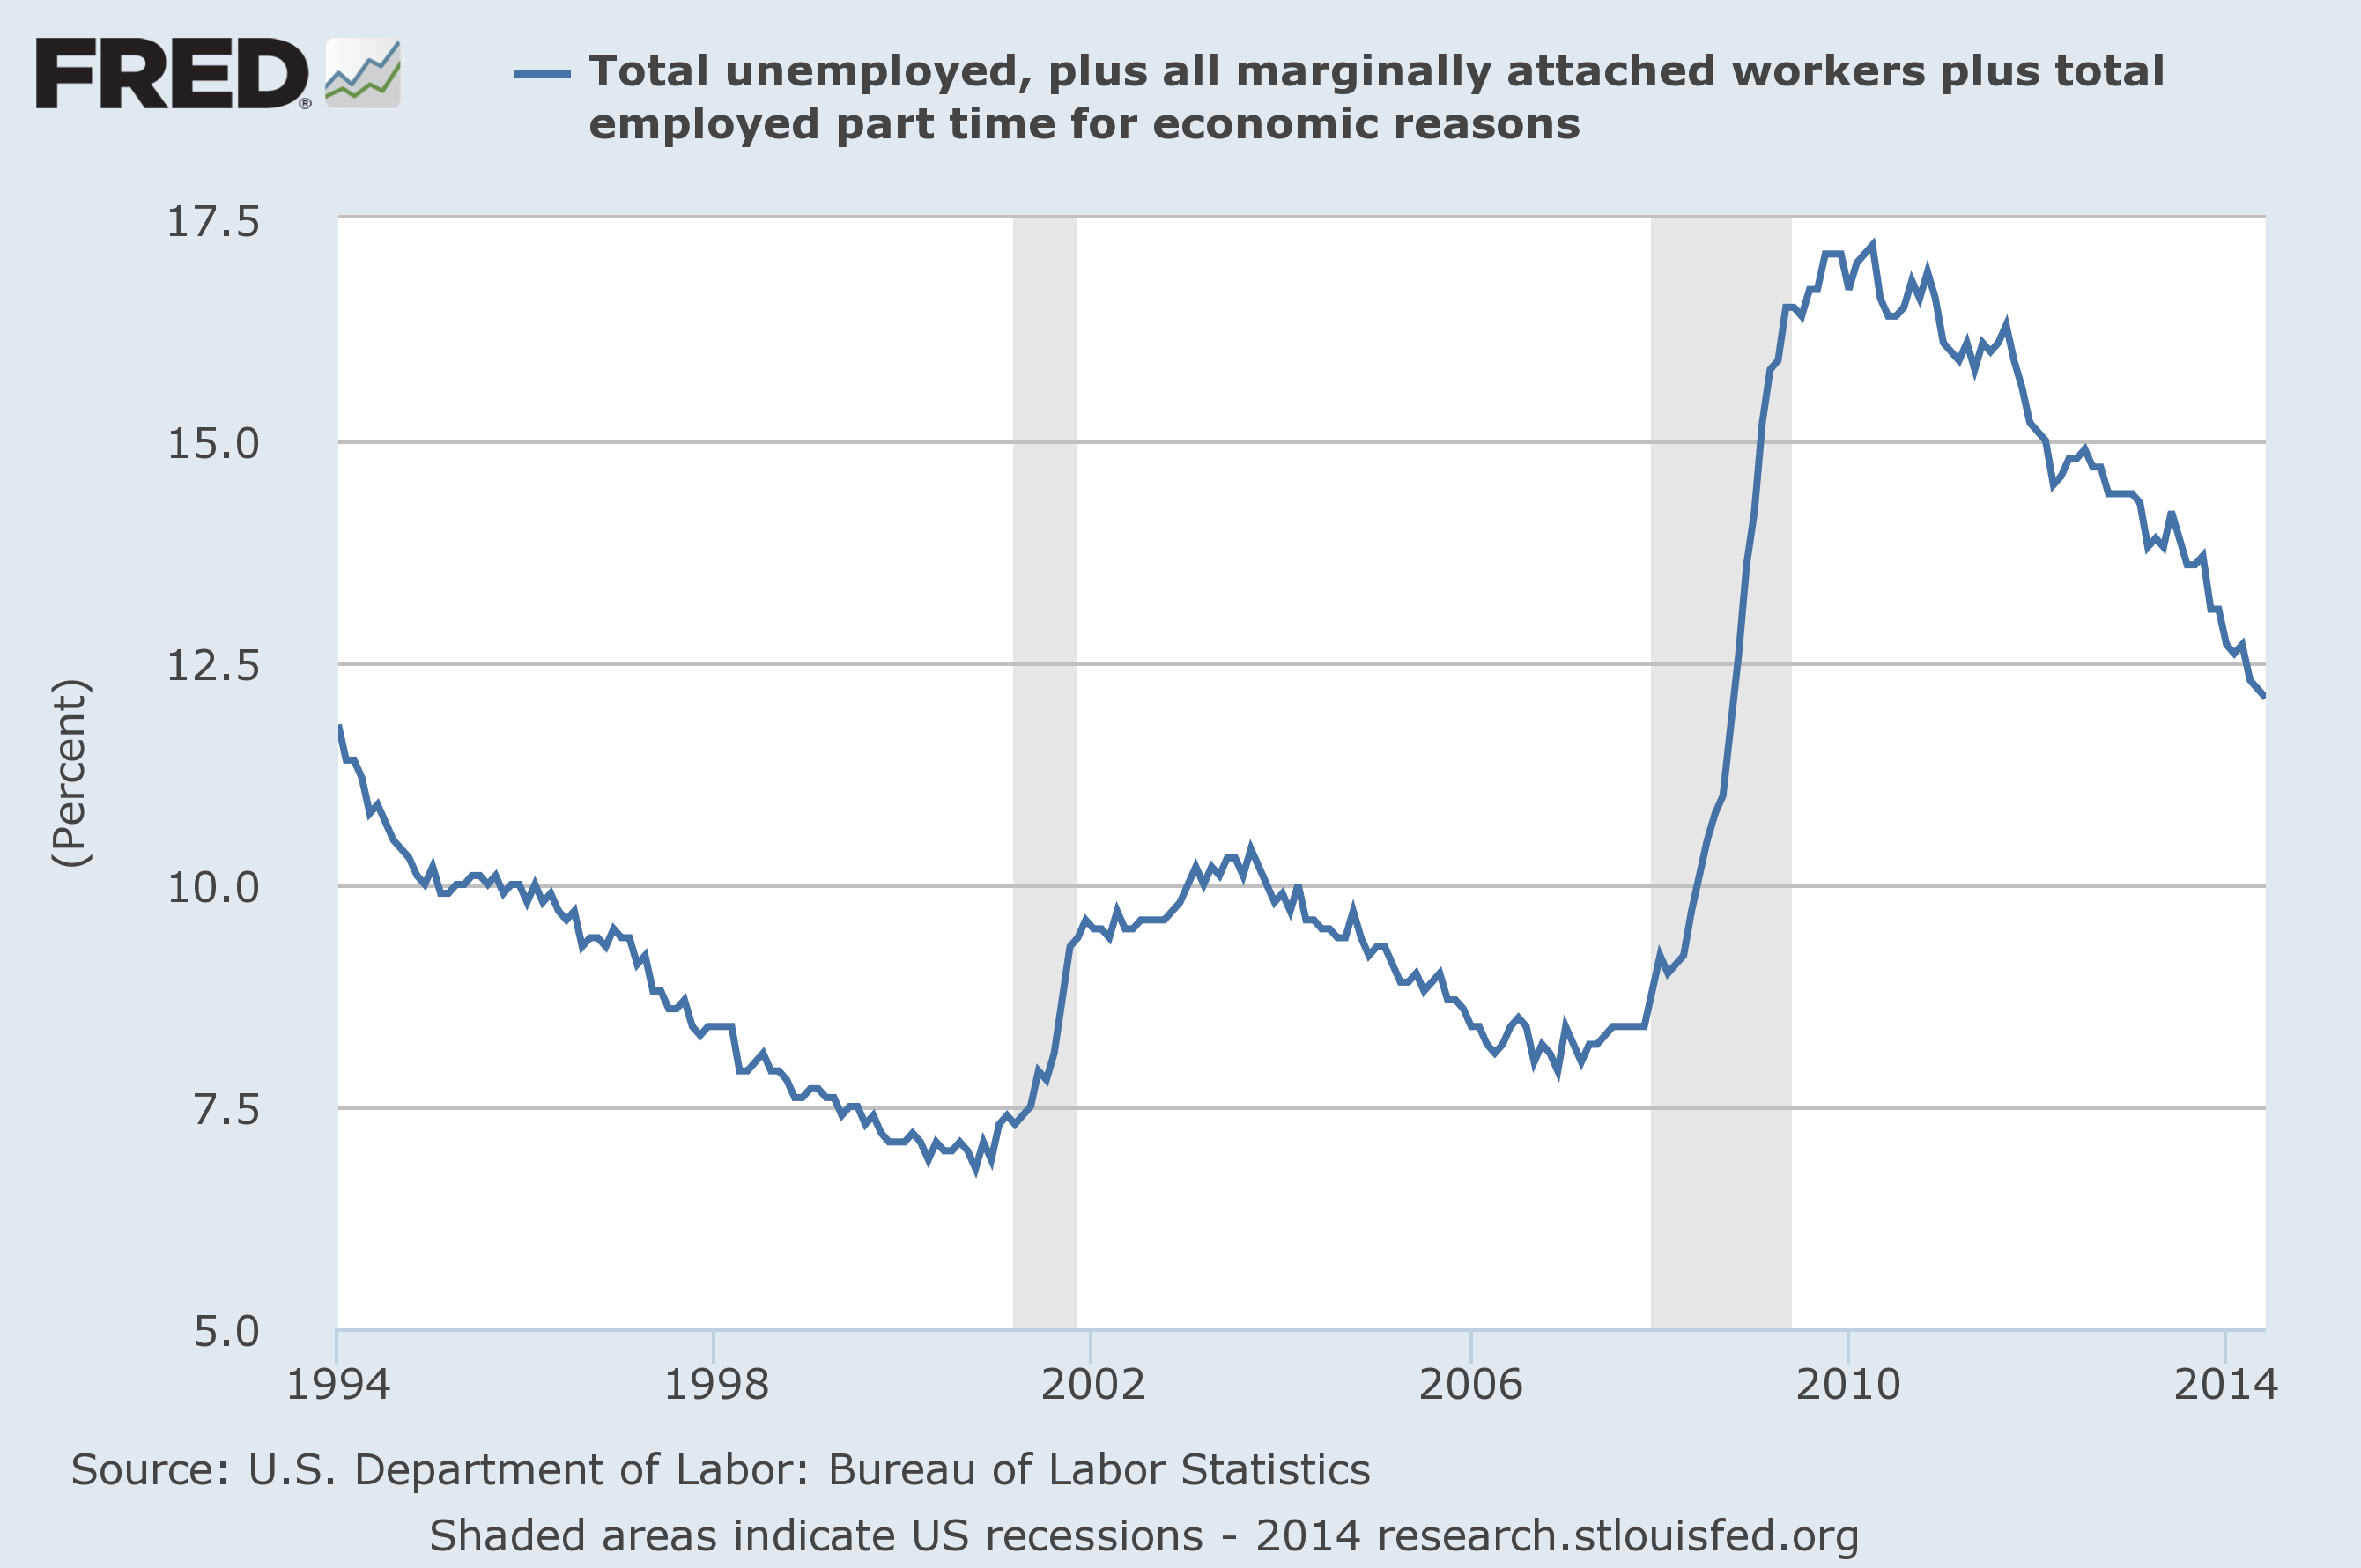
Data Source: FRED, Federal Reserve Economic Data, Federal Reserve Bank of St. Louis: Total unemployed, plus all marginally attached workers plus total employed part time for economic reasons [U6RATE] ; U.S. Department of Labor: Bureau of Labor Statistics; accessed July 3, 2014;
http://research.stlouisfed.org/fred2/series/U6RATE
_____
The Special Note summarizes my overall thoughts about our economic situation
SPX at 1980.39 as this post is written
http://www.macrotrends.net/1377/u6-unemployment-rate
Pls see link above for graphs of U3 and U6
U6 MINUS U3 was approx 4% in 1994 – 2008. Then jumped to 7%, and has come down to 6% in 2014.
U3 is the official unemployment rate.
U6 adds on those workers who are discouraged (as in U5) and also those part-time purely for economic reasons.
While the official unemployment rate IS dropping, the percentage discouraged and part-time is about 50% higher than it was till Jan 2008 >> More workers have been forced out (and don’t get counted in the official rate) or are stuck now in part-time jobs.
BUT the latter are employed, so politicians couldn’t care and business is happy…!
The wage bill has been cut to the extent of that 2-3% increase in U6, i.e., its been this way for 6 years. Structural change, perhaps? Workers have been trained to accept less, and NOW the screws can be tightened some more……