This post is an update to that of April 5, 2012, titled “The Current Gold Price And Its Broader Implications.”
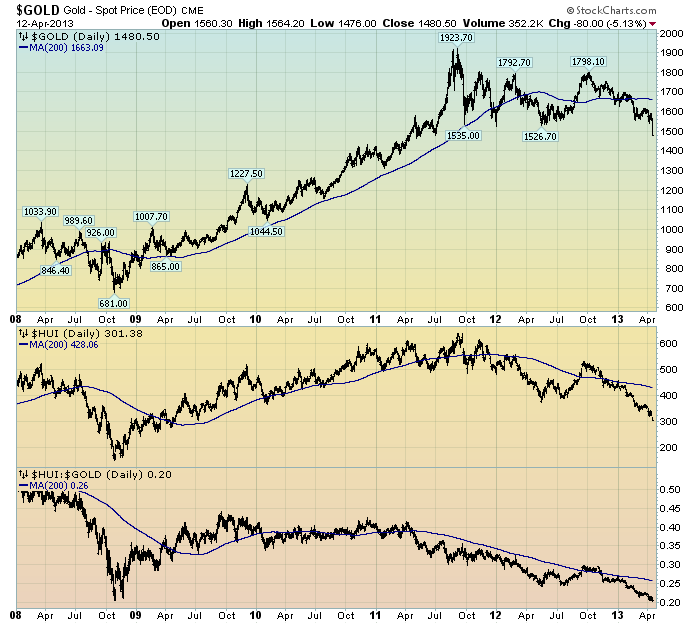
Below is a chart similar to that displayed in the April 5 post:
(click on chart to enlarge image)(chart courtesy of StockCharts.com; chart creation and annotation by the author)
–
The above chart is depicted on a daily basis from 2008 through April 12, with the thin blue line depicting the 200dma of the Gold price, HUI and HUI:Gold ratio. The closing price of Gold on April 12 is $1480.50/oz. I find several items to be noteworthy. First is the decline in the price of Gold, which can be seen in the upper plot of the chart. As one can see, the Gold price has been (relatively) rangebound since its highs in the summer of 2011, but has recently been dropping below that range. Also, the HUI Index has been (generally) dropping since those Gold highs in the summer of 2011. Lastly, one can see that the HUI:Gold ratio has been (generally) sinking during the post-summer 2011 Gold highs as well, and is now roughly at the same lows as those experienced during the Financial Crisis.
In aggregate, I believe the movements in Gold and Gold stocks (using the HUI as a proxy) is disconcerting for various reasons, such as that I explained in the aforementioned April 5 post, which references the post of August 25, 2011, “Gold And Deflationary Pressures.”
_____
The Special Note summarizes my overall thoughts about our economic situation
SPX at 1579.04 as this post is written