In at least two past posts on short-term Treasury yields, those of July 20, 2010 (“2-Year Treasury: Odd Occurrences”) and November 23, 2009 (“Two Notable Developments”) I have discussed the significance of the ultra-low yields seen on the 2-Year Treasury Note and the 3-Month Bill.
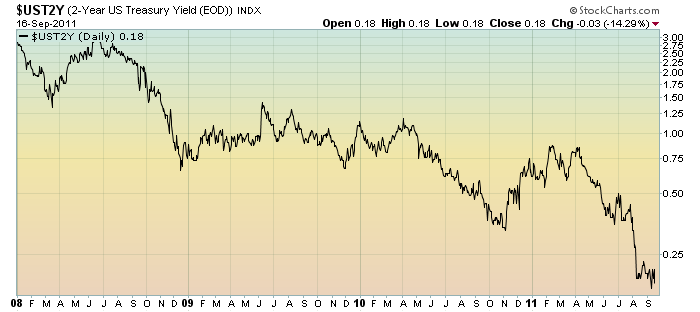
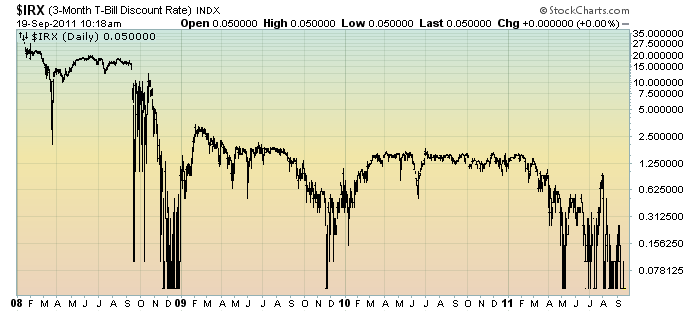
Here are updated charts of each, as of Friday’s close.
First, the 2-Year Treasury Note yield, shown on a daily basis, LOG scale, since 2008:
(click on chart images to enlarge)(charts courtesy of StockCharts.com)
The second is a chart of the 3-Month Treasury Bill yield, also shown on a daily basis, LOG scale, since 2008:
For the various reasons I wrote about in the two aforementioned posts, I continue to find these ultra-low short-term Treasury yields to be disconcerting.
_____
The Special Note summarizes my overall thoughts about our economic situation
SPX at 1189.38 as this post is written

