Over the last few months a notable divergence has occurred between the U.S. and Chinese stock markets.
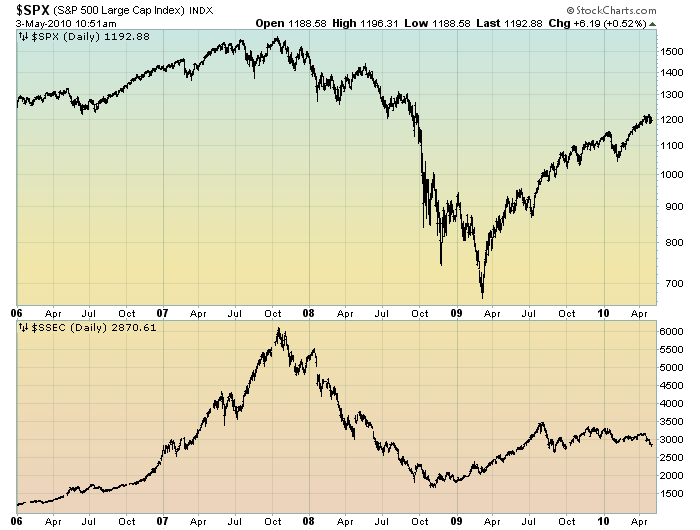
Two charts illustrate this divergence. The first shows the S&P500 vs. the Shanghai Composite on a daily basis:
chart courtesy of StockCharts.com
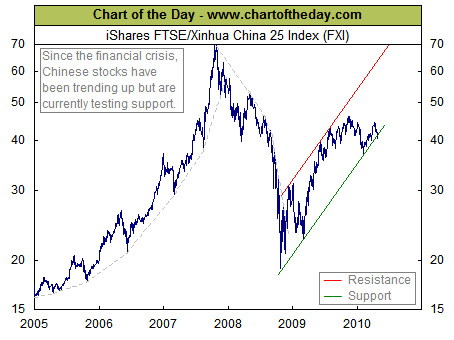
The second chart shows a chart of FXI, the iShares FTSE/Xinhua China 25 Index. This chart is from chartoftheday.com of 4/30/10. One can see the flagging momentum:
It is notable that the Shanghai Composite led the SPX (S&P500) significantly in late ’08 – early ’09, yet it has been stagnant- to-declining lately.
I find this divergence in the SPX and Chinese stock markets to be curious and cautionary. Many companies in the S&P500 are deriving the vast majority of any current revenue growth – not to mention earnings – from overseas, particularly Asia. Given this scenario, it seems strange that the SPX is significantly outperforming the Chinese stock market.
back to <home>
SPX at 1193.6 as this post is written

