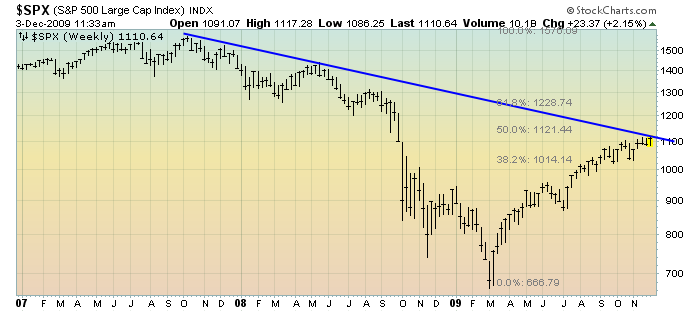
The following chart shows a Weekly Log Chart of the S&P500 from 2007. I have drawn a trendline from the October 2007 highs as well as a retracement indicator from the March 2009 bottom of ~666. (Please note that the trendline and retracement both might be off by a “hair,” but this is relatively immaterial to the main message)
Chart courtesy of StockCharts.com
The trendline is significant as it represents the downtrend line from the October 2007 highs. As one can see, the current S&P500 price of 1110 is very close to that downtrend line.
As well, the current price is very close to the 50% retracement of the move from the S&P500 October 2007 high to the March 2009 low. This 50% retracement is shown in gray and is at 1121.44.
back to <home>
SPX at 1109.58 as this post is written
