Here is an update on various indicators that are supposed to predict and/or depict economic activity. These indicators have been discussed in previous blog posts:
The November 2013 Chicago Fed National Activity Index (CFNAI)(pdf) updated as of November 27, 2013:
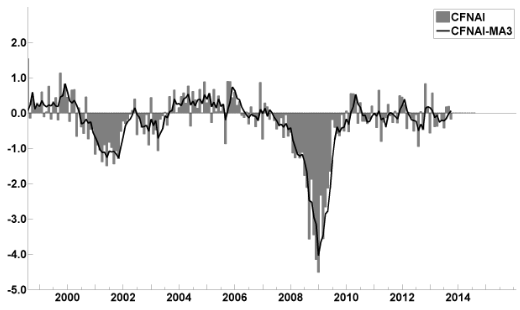
–
The ECRI WLI (Weekly Leading Index):
As of 11/22/13 (incorporating data through 11/15/13) the WLI was at 132.2 and the WLI, Gr. was at 2.4%.
A chart of the WLI, Gr. since 2000, from Doug Short’s blog of November 22 titled “ECRI Recession Watch: Weekly Update” :
–
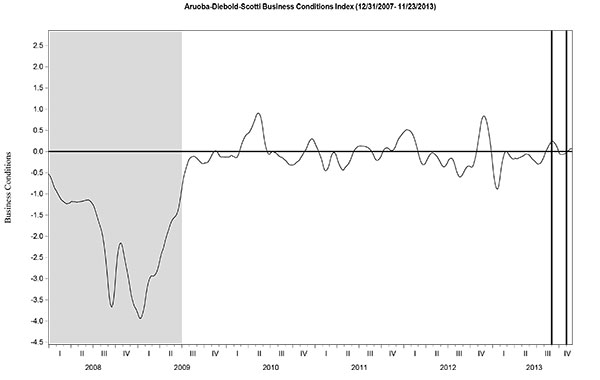
The Aruoba-Diebold-Scotti Business Conditions (ADS) Index:
Here is the latest chart, depicting 12-31-07 through 11-23-13:
–
The Conference Board Leading (LEI) and Coincident (CEI) Economic Indexes:
As per the November 27 press release, the LEI was at 97.5 and the CEI was at 106.9 in October.
An excerpt from the November 27 release:
“The US LEI has increased for four consecutive months,” said Ken Goldstein, Economist for The Conference Board. “Overall, the data reflect strengthening conditions in the underlying economy. However, headwinds still persist from the labor market, accompanied by business caution and concern about federal budget battles. The biggest challenge to date has been relatively weak consumer demand, which continues to be restrained by weak wage growth and slumping confidence.”
_________
I post various indicators and indices because I believe they should be carefully monitored. However, as those familiar with this blog are aware, I do not necessarily agree with what they depict or imply.
_____
The Special Note summarizes my overall thoughts about our economic situation
SPX at 1807.23 as this post is written