The following chart is from the CalculatedRisk post of December 7, 2023 titled “Fed’s Flow of Funds: Household Net Worth Decreased $1.3 Trillion in Q3.” It depicts Total Household Net Worth as a Percent of GDP. The underlying data is from the Federal Reserve’s Z.1 report, “Financial Accounts of the United States“:
(click on chart to enlarge image)
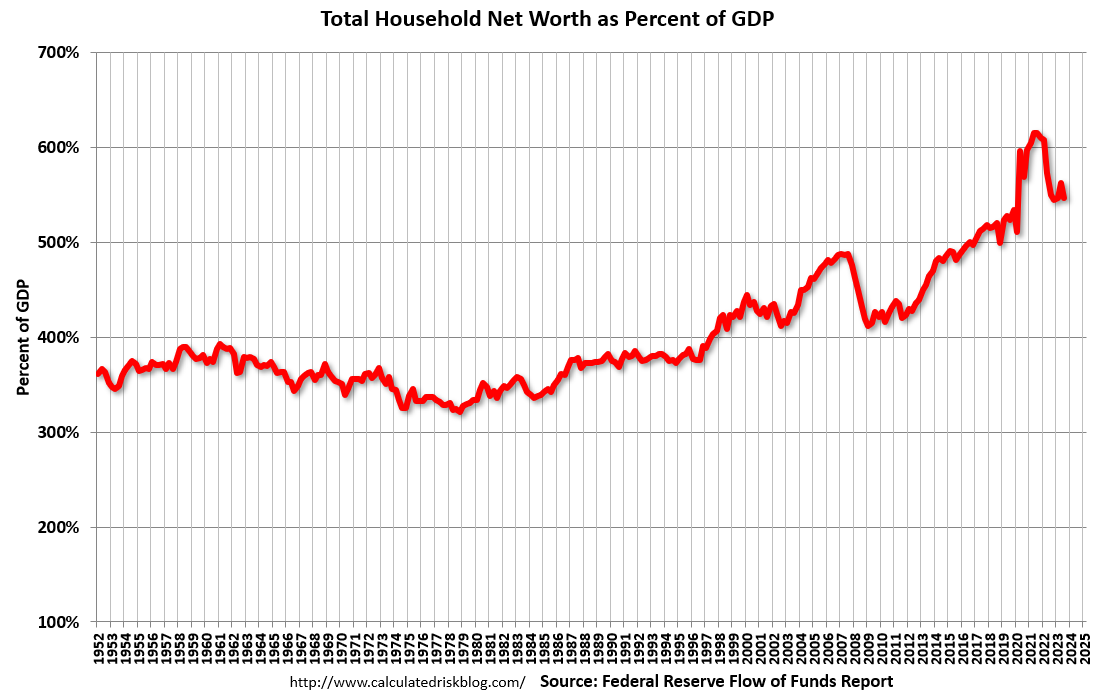
As seen in the above-referenced CalculatedRisk post:
The net worth of households and nonprofits fell to $151.0 trillion during the third quarter of 2023. The value of directly and indirectly held corporate equities decreased $1.7 trillion and the value of real estate increased $0.5 trillion.
As one can see in the above chart, the first outsized peak was in 2000, and attained after the stock market bull market / stock market bubbles and economic strength. The second outsized peak was in 2007, right near the peak of the housing bubble as well as near the stock market peak. A third outsized peak appears to have formed between 2021 and 2022.
_____
The Special Note summarizes my overall thoughts about our economic situation
SPX at 4586.88 as this post is written