U.S. Economic Indicators
Throughout this site there are many discussions of economic indicators. This post is the latest in a series of posts indicating facets of U.S. economic weakness or a notably low growth rate.
The level and trend of economic growth is especially notable at this time. As seen in various estimates, the probability of recession has grown to significant levels.
As seen in the June 2022 Wall Street Journal Economic Forecast Survey the consensus (average estimate) among various economists is for 1.28% GDP growth in 2022, 1.36% GDP growth in 2023, and n/a GDP growth in 2024.
Charts Indicating U.S. Economic Weakness
Below are a small sampling of charts that depict weak growth or contraction, and a brief comment for each:
__
Real Average Hourly Earnings
Various measures of (nominal) average hourly earnings continue to show significant growth. However, due to continuing high inflation, Real Average Hourly Earnings continues to decline. Shown below is a chart of earnings measures as seen in The Economics Daily of June 16, 2022 titled “Real average hourly earnings down 3.0 percent over the 12 months ending May 2022”:
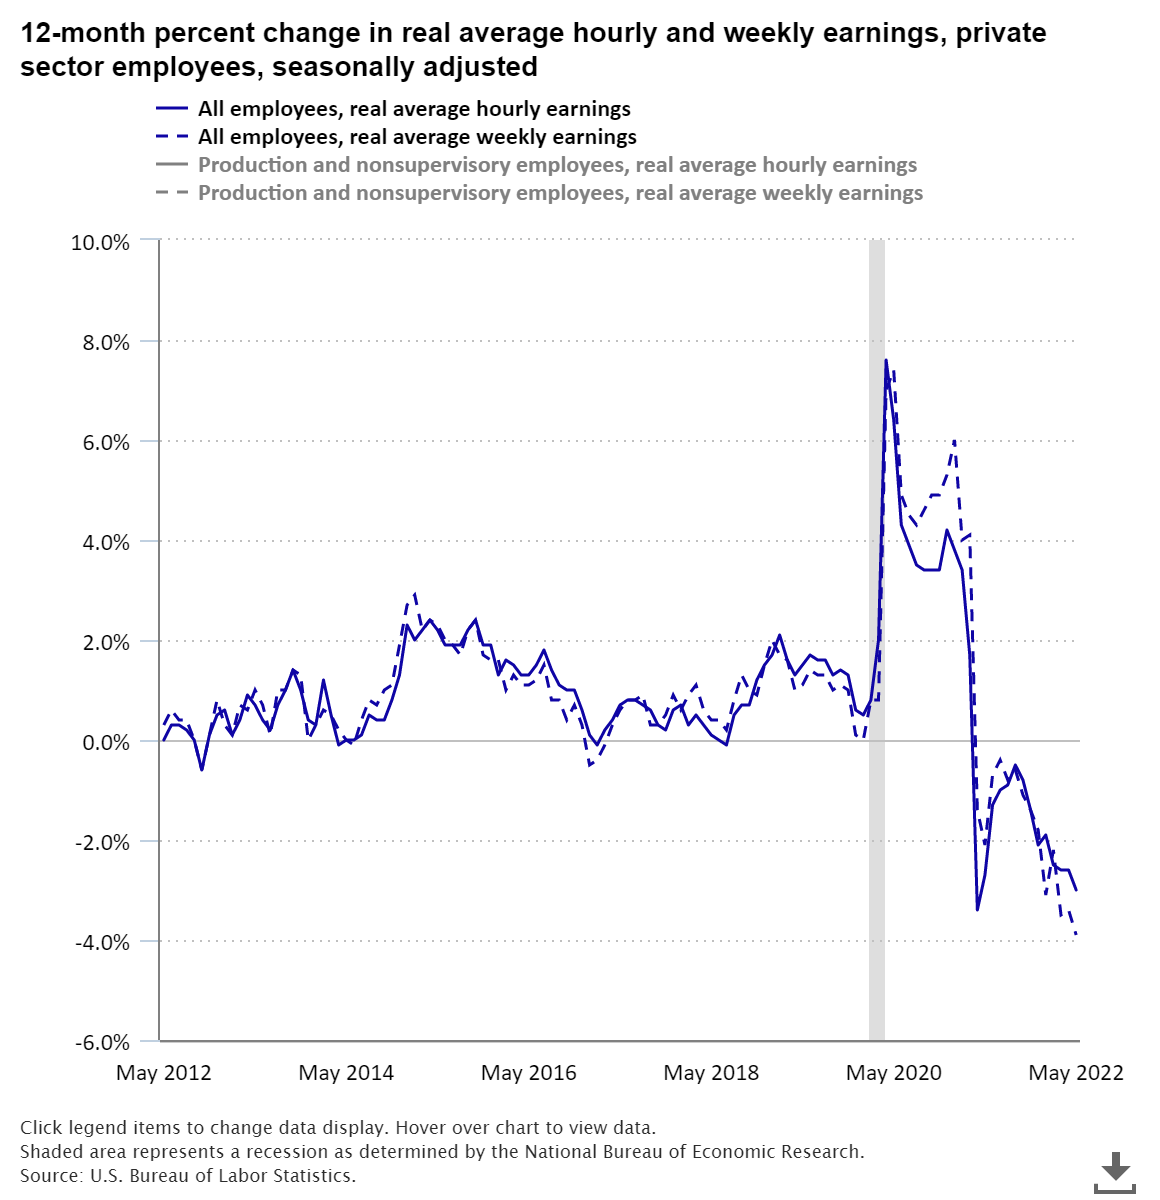
source: Bureau of Labor Statistics, U.S. Department of Labor, The Economics Daily, Real average hourly earnings down 3.0 percent over the 12 months ending May 2022 at https://www.bls.gov/opub/ted/2022/real-average-hourly-earnings-down-3-0-percent-over-the-12-months-ending-may-2022.htm (visited July 06, 2022).
__
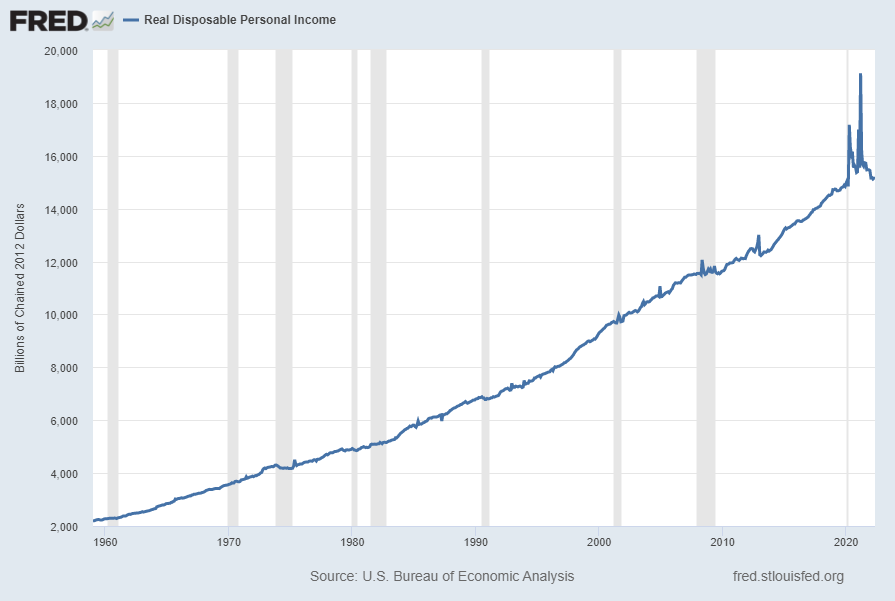
Real Disposable Personal Income (DSPIC96)
“Real Disposable Personal Income” (DSPIC96) has been volatile since 2020, and ongoing high inflation is presenting a hurdle to its continued growth. Shown below is this measure with last value of $15,144.8 Billion through May, last updated June 30, 2022:
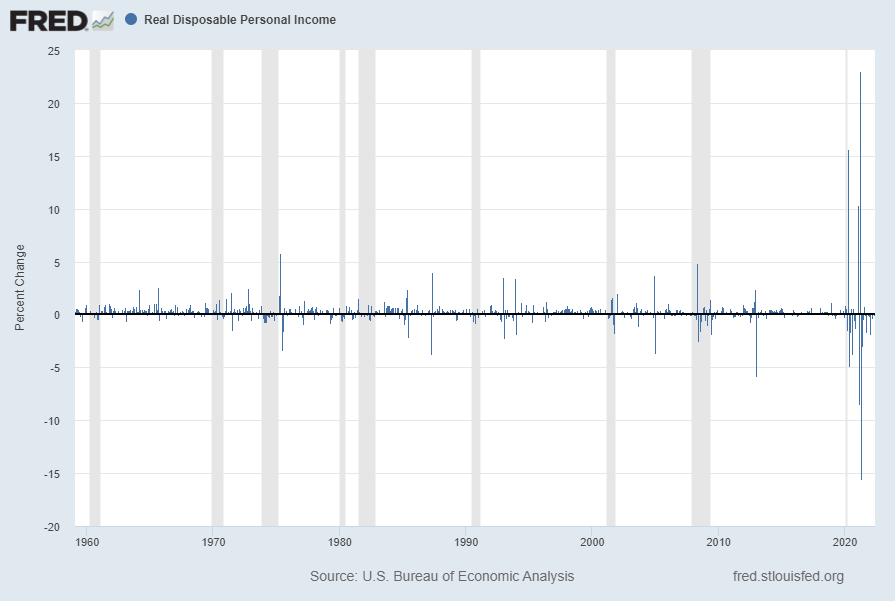
Below is this measure displayed on a “Percent Change” (from prior month) basis with last value of -.1%:
Below is this measure displayed on a “Percent Change From Year Ago” basis with value -3.3%:
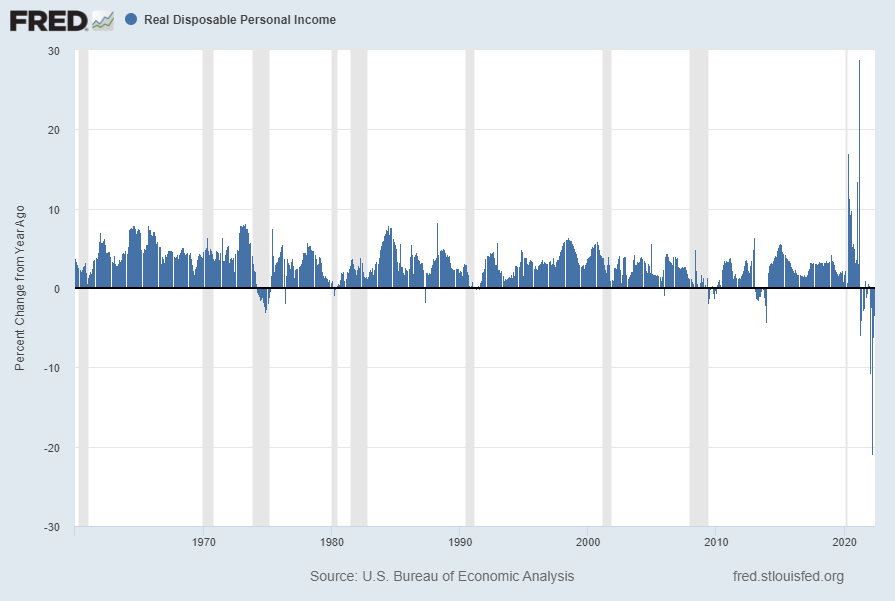
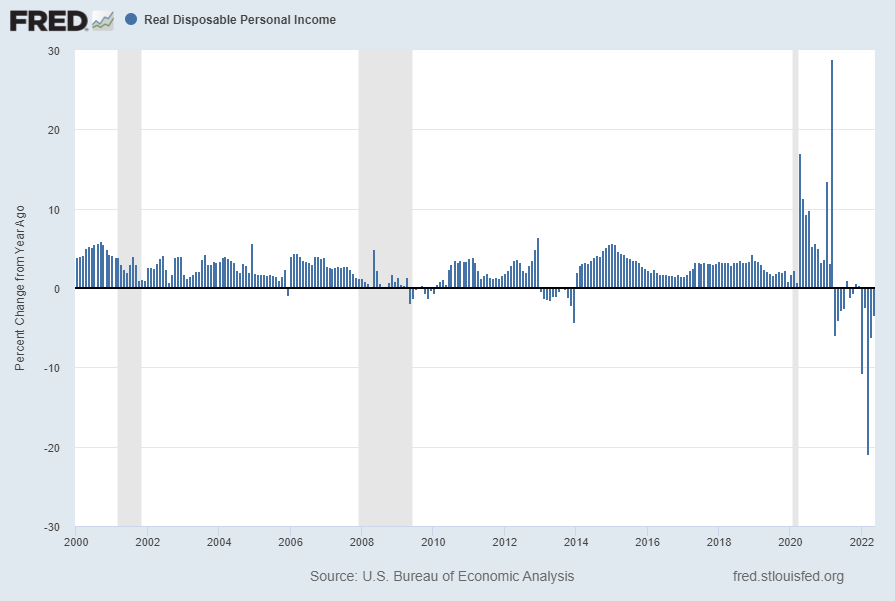
source: U.S. Bureau of Economic Analysis, Real Disposable Personal Income [DSPIC96], retrieved from FRED, Federal Reserve Bank of St. Louis; accessed July 6, 2022: https://fred.stlouisfed.org/series/DSPIC96
__
The Yield Curve (T10Y2Y)
Many people believe that the Yield Curve is a leading economic indicator for the United States economy.
On March 1, 2010, I wrote a post on the issue, titled “The Yield Curve As A Leading Economic Indicator.”
While I continue to have the stated reservations regarding the “Yield Curve” as an indicator, I do believe that it should be monitored.
The U.S. Yield Curve (one proxy seen below) while positive, is (all things considered) notably low when viewed from a long-term perspective. Below is the spread between the 10-Year Treasury Constant Maturity and the 2-Year Treasury Constant Maturity from June 1976 through the July 5, 2022 value, showing a value of 0.0% [10-Year Treasury Yield (FRED DGS10) of 2.88% as of the July 5 update, 2-Year Treasury Yield (FRED DGS2) of 2.84% as of the July 5 update]:
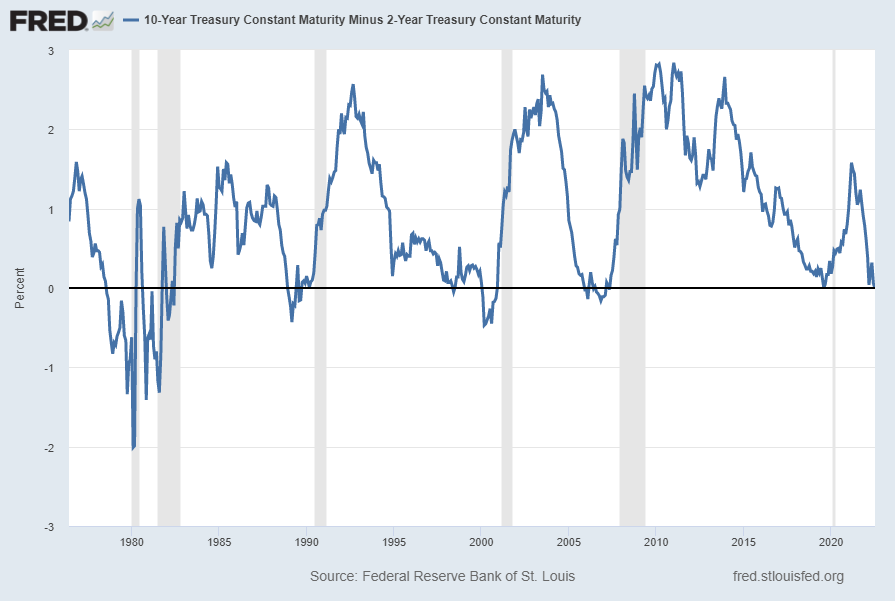
source: Federal Reserve Bank of St. Louis, 10-Year Treasury Constant Maturity Minus 2-Year Treasury Constant Maturity [T10Y2Y], retrieved from FRED, Federal Reserve Bank of St. Louis; accessed July 6, 2022: https://fred.stlouisfed.org/series/T10Y2Y
__
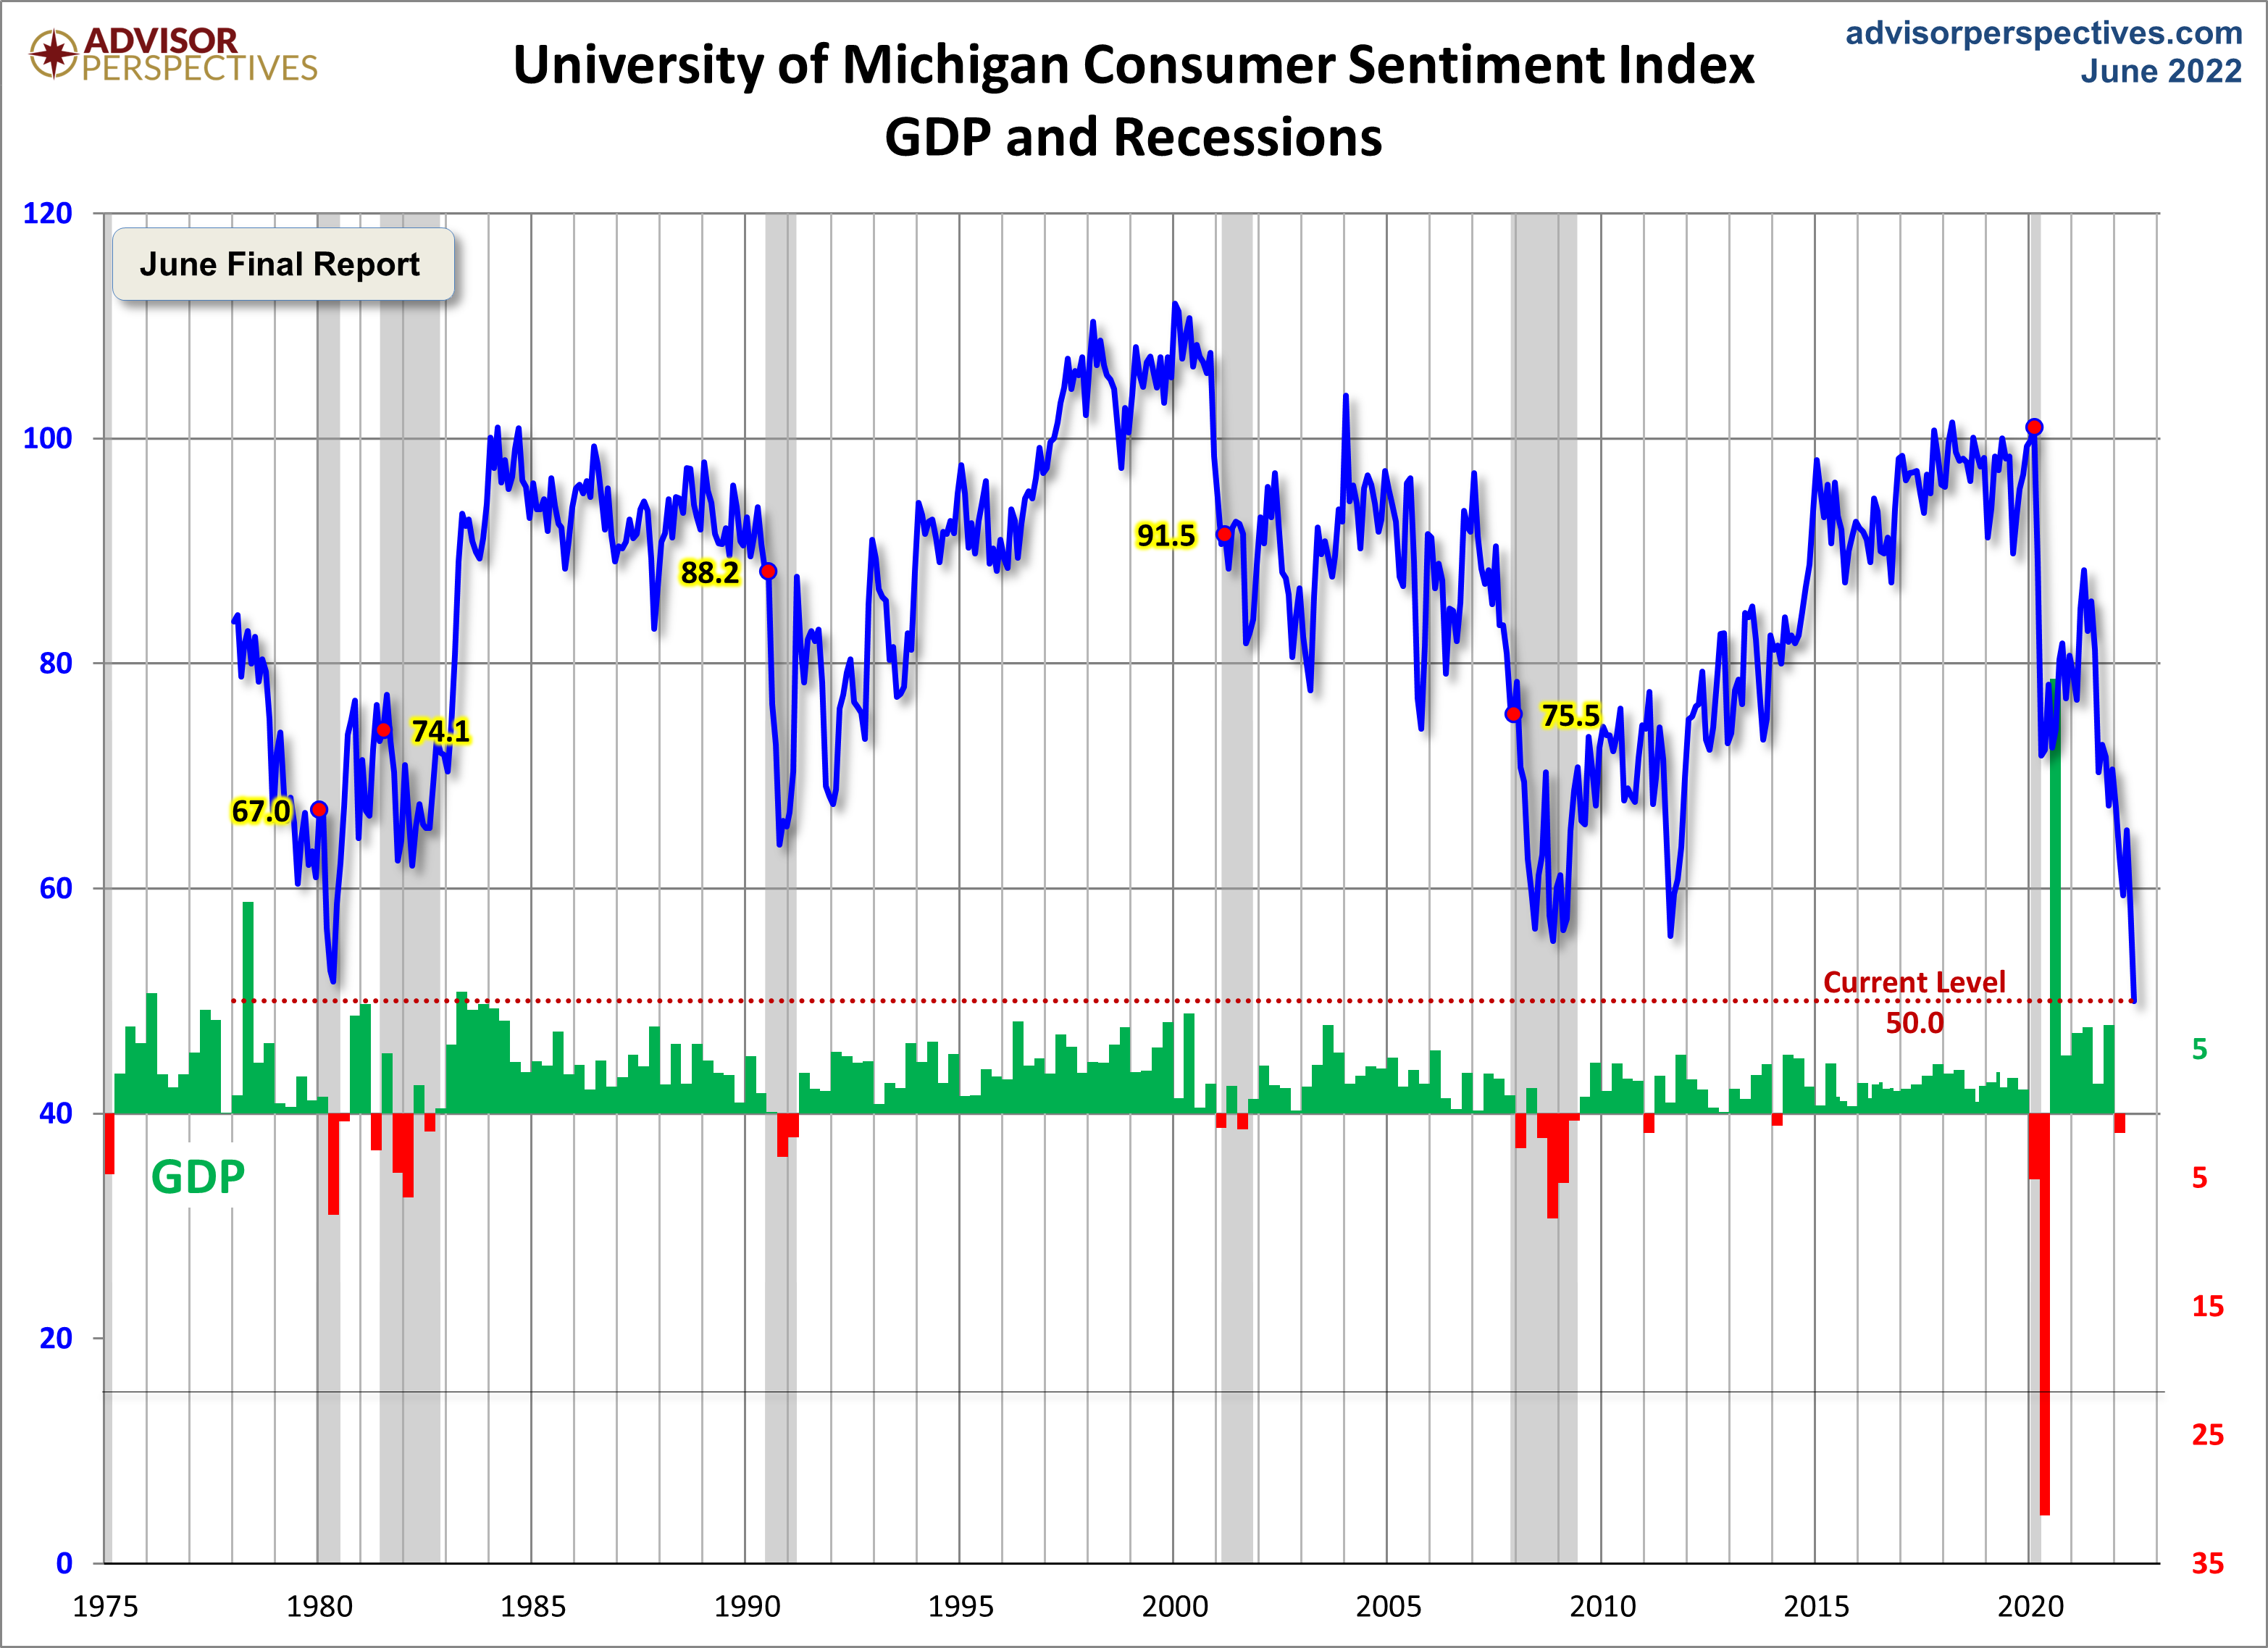
University of Michigan Consumer Sentiment Index
The University of Michigan Consumer Sentiment Index reached a record-low level of 50.0 in June. While, as I have previously stated, I don’t believe that confidence surveys should be overemphasized, I find this level to be notable for several reasons.
A long-term chart of the University of Michigan Consumer Sentiment Index, from the Advisor Perspectives’ site, in the June 24, 2022 post titled “Michigan Consumer Sentiment Lowest Reading on Record“:
__
Other Indicators
As mentioned previously, many other indicators discussed on this site indicate slow economic growth or economic contraction, if not outright (gravely) problematical economic conditions.
_____
The Special Note summarizes my overall thoughts about our economic situation
SPX at 3845.08 as this post is written