U.S. Economic Indicators
Throughout this site there are many discussions of economic indicators. This post is the latest in a series of posts indicating facets of U.S. economic weakness or a notably low growth rate.
The level and trend of economic growth is especially notable at this time. As seen in various measures and near-term projections, the U.S. economy had undergone an outsized level of economic contraction in 2020. However, most people believe (and virtually all prominent economic forecasts indicate) that this historic level of contraction will have proven ephemeral in nature; i.e. an economic expansion will continue.
As seen in the January 2022 Wall Street Journal Economic Forecast Survey the consensus (average estimate) among various economists is for 3.30% GDP growth in 2022, 2.42% GDP growth in 2023, and 2.22% GDP growth in 2024.
Charts Indicating U.S. Economic Weakness
Below are a small sampling of charts that depict weak growth or contraction, and a brief comment for each:
__
The Yield Curve
Many people believe that the Yield Curve is a leading economic indicator for the United States economy.
On March 1, 2010, I wrote a post on the issue, titled “The Yield Curve As A Leading Economic Indicator.”
While I continue to have the stated reservations regarding the “Yield Curve” as an indicator, I do believe that it should be monitored.
The U.S. Yield Curve (one proxy seen below) while positive, is (all things considered) relatively low when viewed from a long-term perspective. Below is the spread between the 10-Year Treasury Constant Maturity and the 2-Year Treasury Constant Maturity from June 1976 through the March 9, 2022 value, showing a value of .23% [10-Year Treasury Yield (FRED DGS10) of 1.86% as of March 8, 2-Year Treasury Yield (FRED DGS2) of 1.63% as of March 8]:
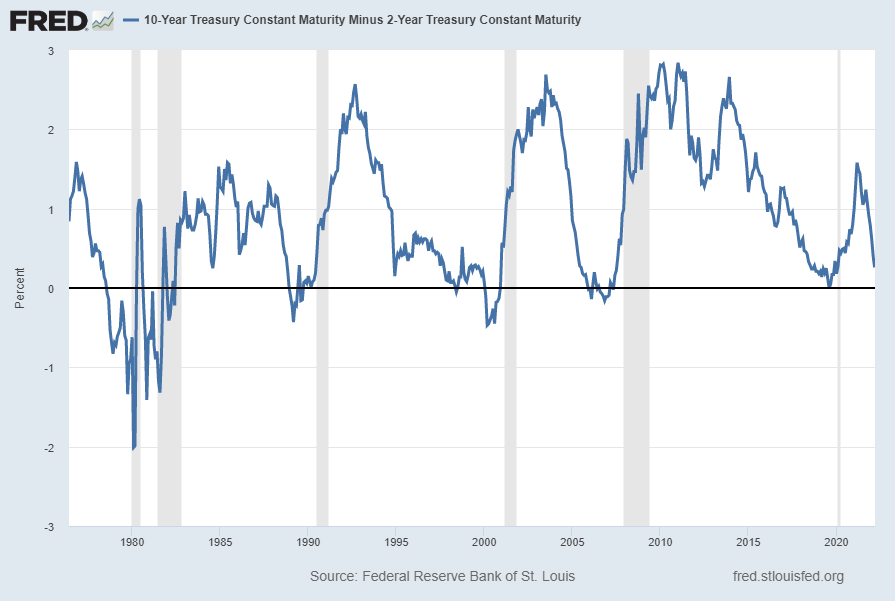
source: Federal Reserve Bank of St. Louis, 10-Year Treasury Constant Maturity Minus 2-Year Treasury Constant Maturity [T10Y2Y], retrieved from FRED, Federal Reserve Bank of St. Louis; accessed March 10, 2022: https://fred.stlouisfed.org/series/T10Y2Y
__
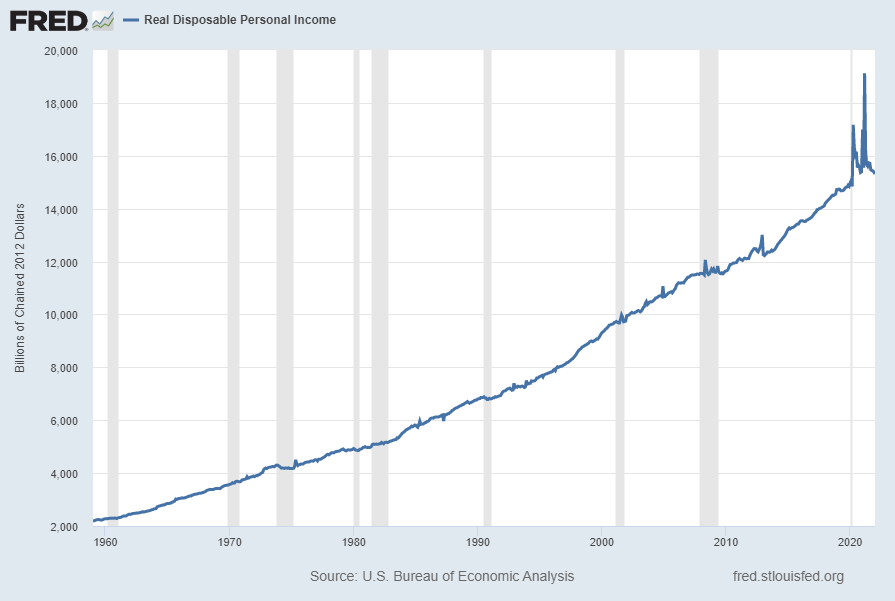
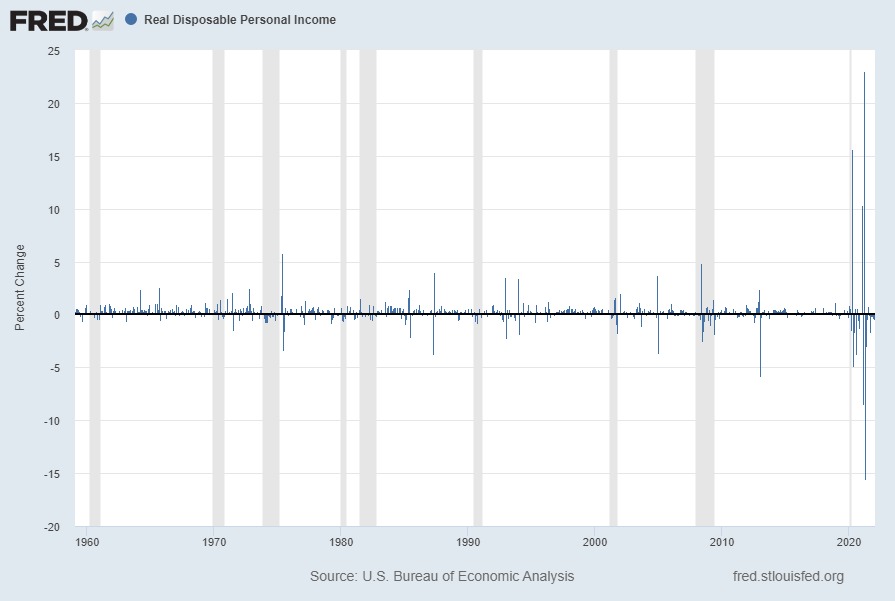
Real Disposable Personal Income (DSPIC96)
“Real Disposable Personal Income” (DSPIC96) has been volatile since 2020, and ongoing high inflation is presenting a hurdle to its continued growth. Shown below is this measure with last value of $15,309.60 through January, last updated February 25, 2022:
Below is this measure displayed on a “Percent Change” (from prior month) basis with last value of -.5%:
Below is this measure displayed on a “Percent Change From Year Ago” basis with value -9.9%:
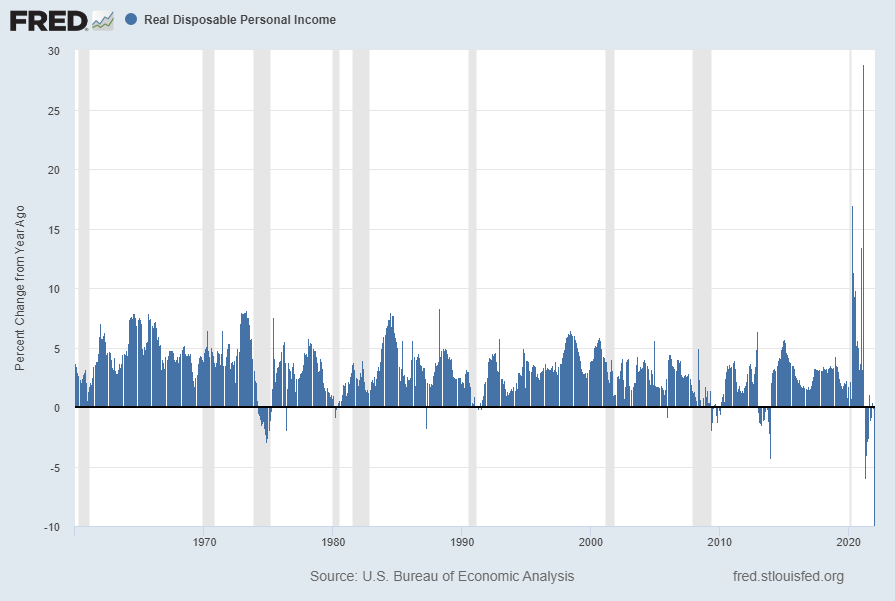
source: U.S. Bureau of Economic Analysis, Real Disposable Personal Income [DSPIC96], retrieved from FRED, Federal Reserve Bank of St. Louis; accessed March 9, 2022: https://fred.stlouisfed.org/series/DSPIC96
__
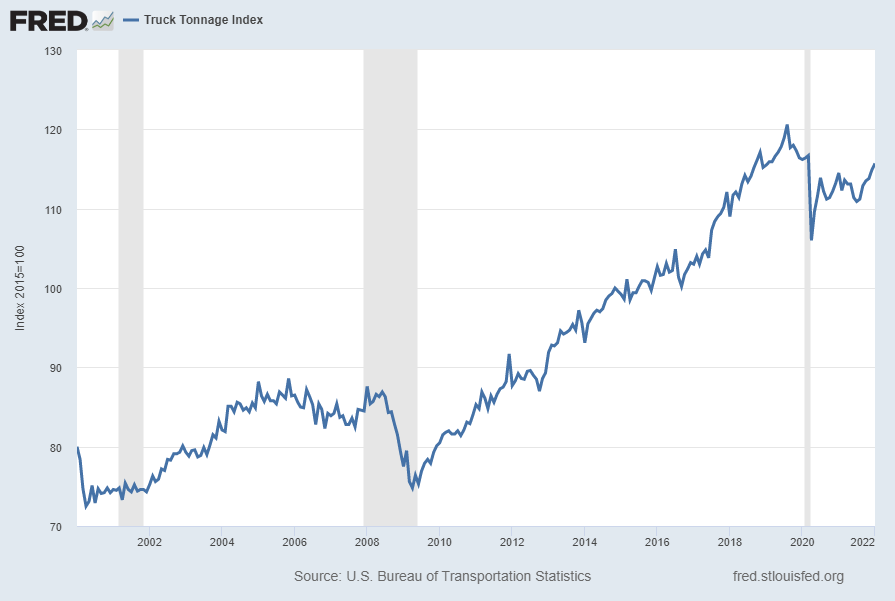
Truck Tonnage (TRUCKD11)
“Truck Tonnage” (TRUCKD11) has yet to reach its pre-pandemic peak. Shown below is this measure with last value of 115.7 through January, last updated March 9, 2022:
Below is this measure displayed on a “Percent Change From Year Ago” basis with value 1.0%:
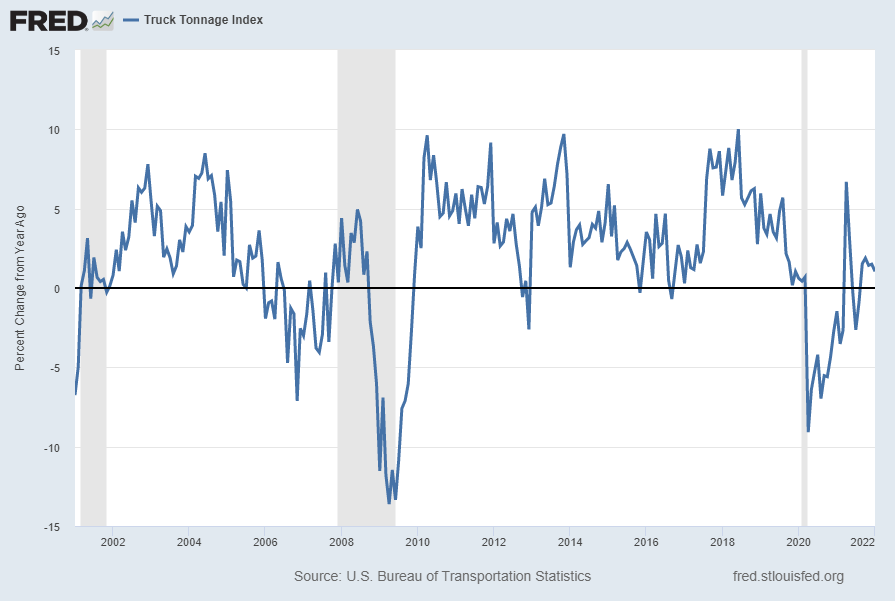
source: U.S. Bureau of Transportation Statistics, Truck Tonnage Index [TRUCKD11], retrieved from FRED, Federal Reserve Bank of St. Louis; accessed March 10, 2022: https://fred.stlouisfed.org/series/TRUCKD11
__
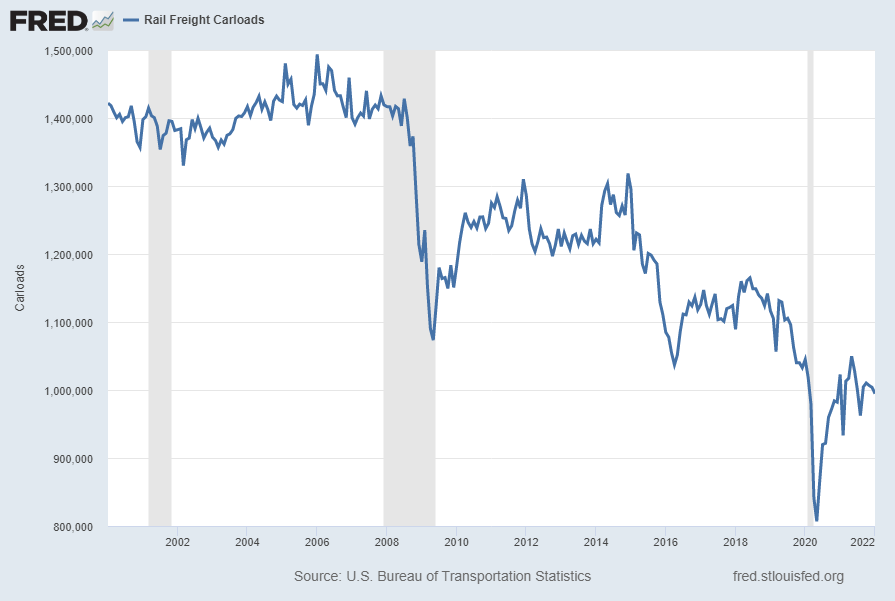
Rail Freight Carloads (RAILFRTCARLOADSD11)
“Rail Freight Carloads” continues to show a generally downward progression from a longer-term perspective. Shown below is a chart with data through January 2022 (last value of 994,676), last updated March 9, 2022:
Here is the same measure on a “Percent Change From Year Ago” basis, with value -2.8%:
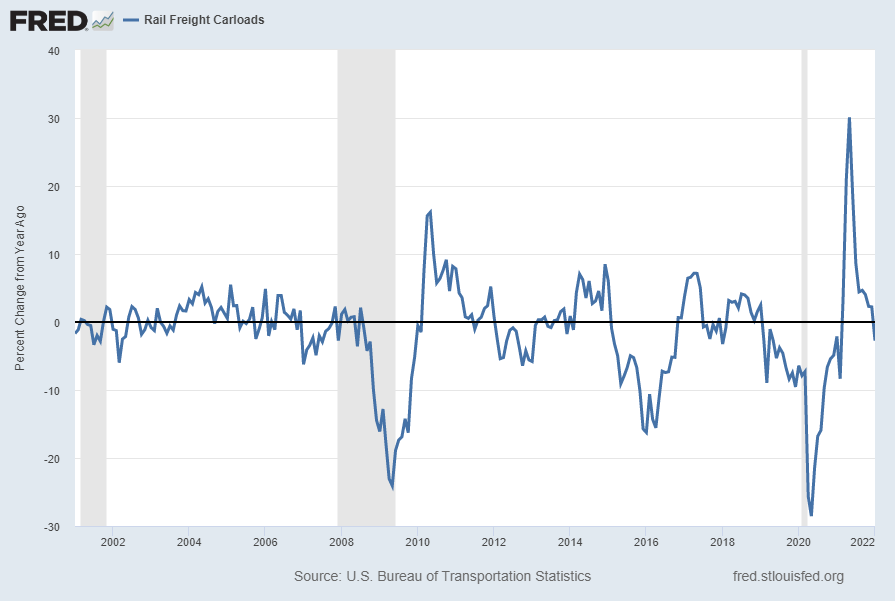
source: U.S. Bureau of Transportation Statistics, Rail Freight Carloads [RAILFRTCARLOADSD11], retrieved from FRED, Federal Reserve Bank of St. Louis; accessed March 10, 2022: https://fred.stlouisfed.org/series/RAILFRTCARLOADSD11
__
Other Indicators
As mentioned previously, many other indicators discussed on this site indicate slow economic growth or economic contraction, if not outright (gravely) problematical economic conditions.
_____
The Special Note summarizes my overall thoughts about our economic situation
SPX at 4259.52 as this post is written