U.S. Economic Indicators
Throughout this site there are many discussions of economic indicators. This post is the latest in a series of posts indicating facets of U.S. economic weakness or a notably low growth rate.
The level and trend of economic growth is especially notable at this time. As seen in various measures and near-term projections, the U.S. economy had undergone an outsized level of economic contraction in 2020. However, most people believe (and virtually all prominent economic forecasts indicate) that this historic level of contraction will have proven ephemeral in nature; i.e. an economic expansion will continue.
As seen in the October 2021 Wall Street Journal Economic Forecast Survey the consensus (average estimate) among various economists is for 5.22% GDP growth in 2021, 3.59% GDP growth in 2022, 2.53% GDP growth in 2023, and 2.23% GDP growth in 2024.
Charts Indicating U.S. Economic Weakness
Below are a small sampling of charts that depict weak growth or contraction, and a brief comment for each:
__
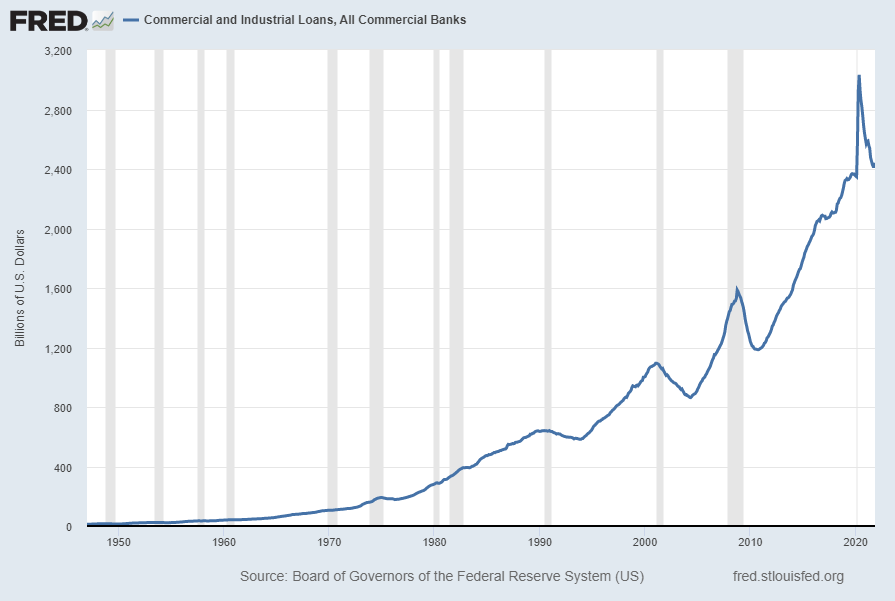
Commercial And Industrial Loans, All Commercial Banks (BUSLOANS)
“Commercial And Industrial Loans, All Commercial Banks” (BUSLOANS) has recently been declining. Shown below is this measure with last value of $2,441.1506 Billion through November 2021, last updated January 7, 2022:
Below is this measure displayed on a “Percent Change From Year Ago” basis with value -7.6%:
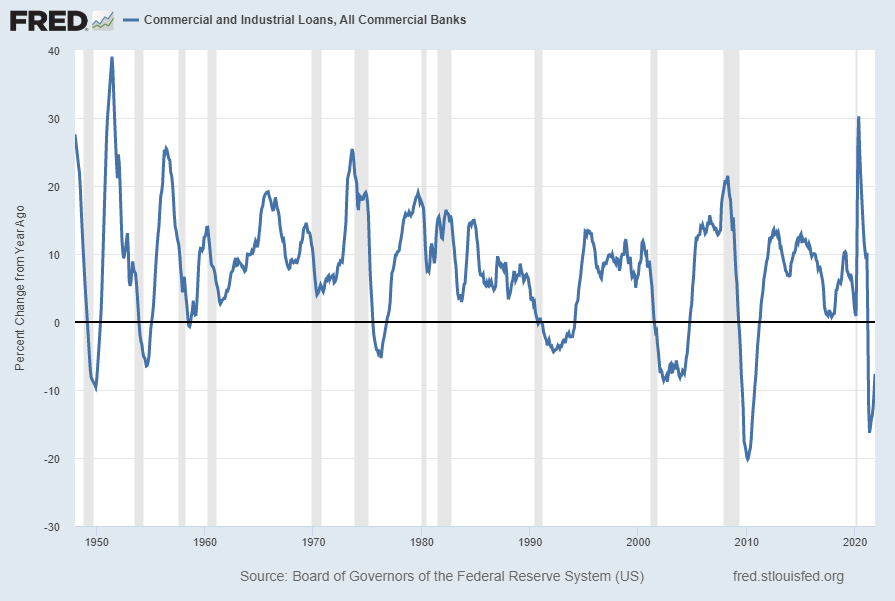
source: Board of Governors of the Federal Reserve System (US), Commercial and Industrial Loans, All Commercial Banks [BUSLOANS], retrieved from FRED, Federal Reserve Bank of St. Louis; accessed January 10, 2022: https://fred.stlouisfed.org/series/BUSLOANS
__
The Yield Curve
Many people believe that the Yield Curve is a leading economic indicator for the United States economy.
On March 1, 2010, I wrote a post on the issue, titled “The Yield Curve As A Leading Economic Indicator.”
While I continue to have the stated reservations regarding the “Yield Curve” as an indicator, I do believe that it should be monitored.
The U.S. Yield Curve (one proxy seen below) while positive, is (all things considered) relatively low when viewed from a long-term perspective. Below is the spread between the 10-Year Treasury Constant Maturity and the 3-Month Treasury Constant Maturity from 1982 through the January 10, 2022 value, showing a value of 1.65% [10-Year Treasury Yield (FRED DGS10) of 1.76% as of January 7, 3-Month Treasury Yield (FRED DGS3MO) of .10% as of January 7]:
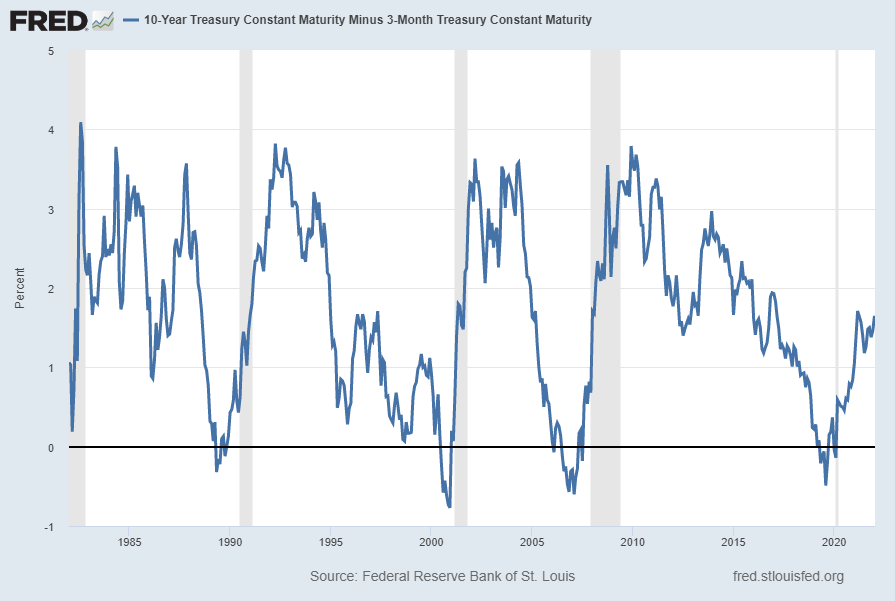
source: Federal Reserve Bank of St. Louis, 10-Year Treasury Constant Maturity Minus 3-Month Treasury Constant Maturity [T10Y3M], retrieved from FRED, Federal Reserve Bank of St. Louis; accessed January 11, 2022: https://fred.stlouisfed.org/series/T10Y3M
__
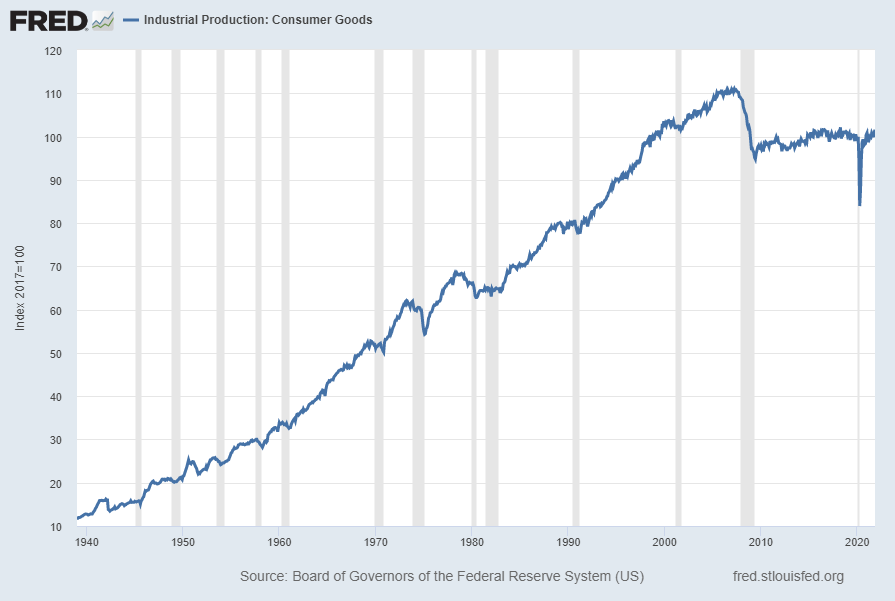
Industrial Production: Consumer Goods (IPCONGD)
The “Industrial Production: Consumer Goods” measure has been relatively subdued since the Financial Crisis. Shown below is a long-term chart of this measure (displayed from 1939), with last value of 101.5776 through November 2021, last updated December 16, 2021:
Displayed below is this same IPCONGD measure on a “Percent Change From Year Ago” basis. The current value is 3.3%:
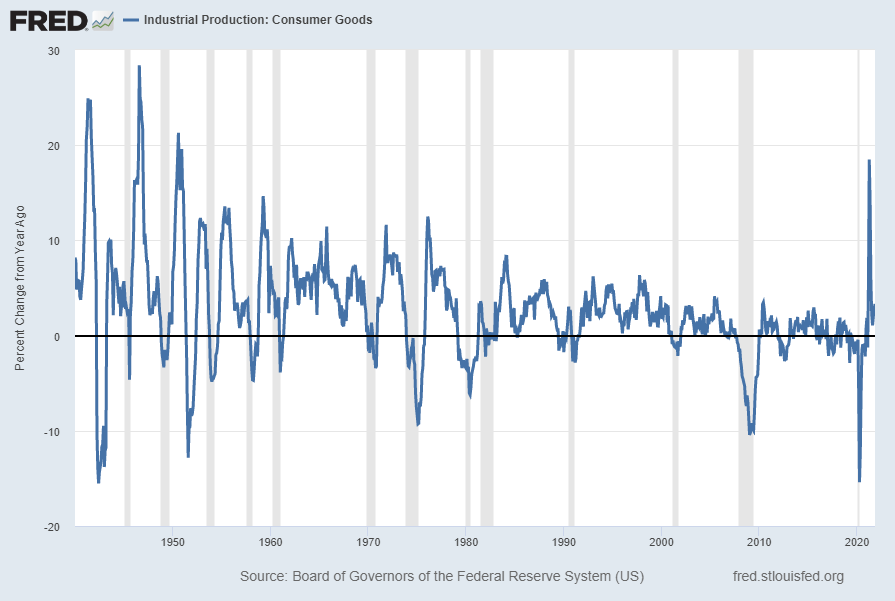
source: Board of Governors of the Federal Reserve System (US), Industrial Production: Consumer Goods [IPCONGD], retrieved from FRED, Federal Reserve Bank of St. Louis; accessed January 11, 2022: https://fred.stlouisfed.org/series/IPCONGD
__
Population Growth (POPTHM)
Shown below is a long-term chart of U.S. population growth on a “Percent Change From A Year Ago” basis with value .3% through November 2021, as of the December 23, 2021 update. The declining nature of the growth rate is notable and may in itself deserve consideration as an economic indicator:
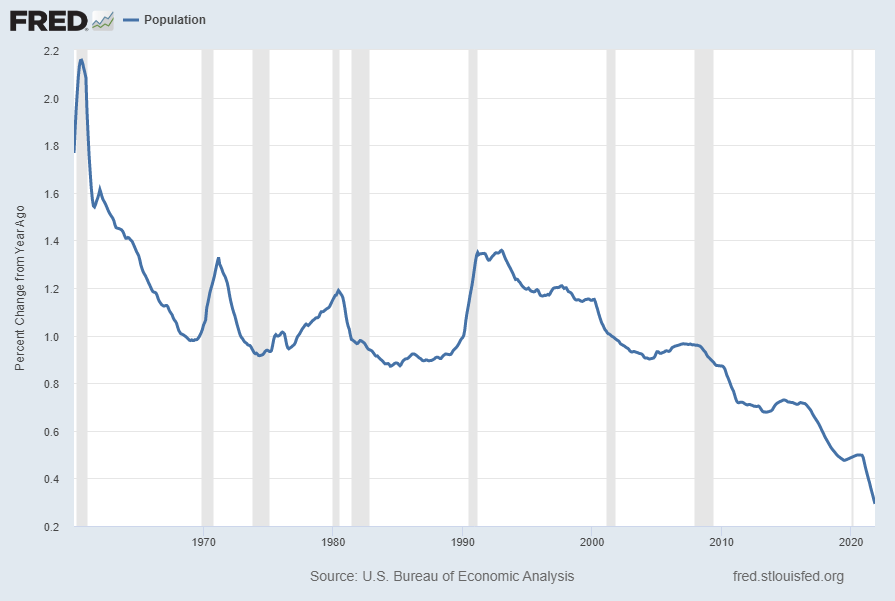
source: U.S. Bureau of the Census, Total Population: All Ages including Armed Forces Overseas [POP], retrieved from FRED, Federal Reserve Bank of St. Louis; accessed January 11, 2022: https://fred.stlouisfed.org/series/POPTHM
__
Other Indicators
As mentioned previously, many other indicators discussed on this site indicate slow economic growth or economic contraction, if not outright (gravely) problematical economic conditions.
_____
The Special Note summarizes my overall thoughts about our economic situation
SPX at 4660.41 as this post is written