U.S. Economic Indicators
Throughout this site there are many discussions of economic indicators. This post is the latest in a series of posts indicating facets of U.S. economic weakness or a notably low growth rate.
The level and trend of economic growth is especially notable at this time. As seen in various measures and near-term projections, the U.S. economy had undergone an outsized level of economic contraction in 2020. However, most people believe (and virtually all prominent economic forecasts indicate) that this historic level of contraction will prove ephemeral in nature; i.e. an economic expansion will continue.
As seen in the July 2021 Wall Street Journal Economic Forecast Survey the consensus (average estimate) among various economists is for 6.89% GDP growth in 2021, 3.24% GDP growth in 2022, and 2.30% GDP growth in 2023.
Charts Indicating U.S. Economic Weakness
Below are a small sampling of charts that depict weak growth or contraction, and a brief comment for each:
__
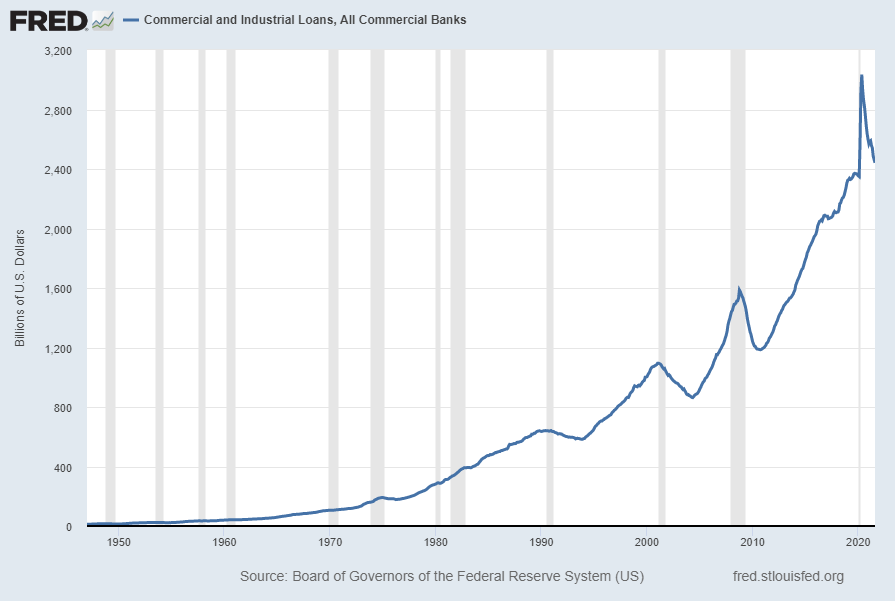
Commercial And Industrial Loans, All Commercial Banks (BUSLOANS)
“Commercial And Industrial Loans, All Commercial Banks” (BUSLOANS) has recently been declining. Shown below is this measure with last value of $2,441.6606 Billion through August, last updated October 8, 2021:
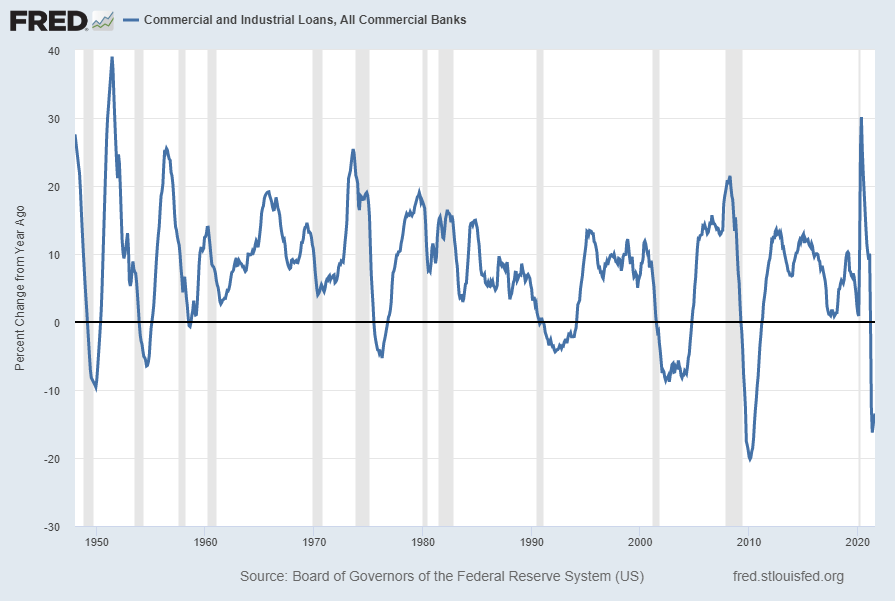
Below is this measure displayed on a “Percent Change From Year Ago” basis with value -13.5%:
source: Board of Governors of the Federal Reserve System (US), Commercial and Industrial Loans, All Commercial Banks [BUSLOANS], retrieved from FRED, Federal Reserve Bank of St. Louis; accessed October 12, 2021: https://fred.stlouisfed.org/series/BUSLOANS
__
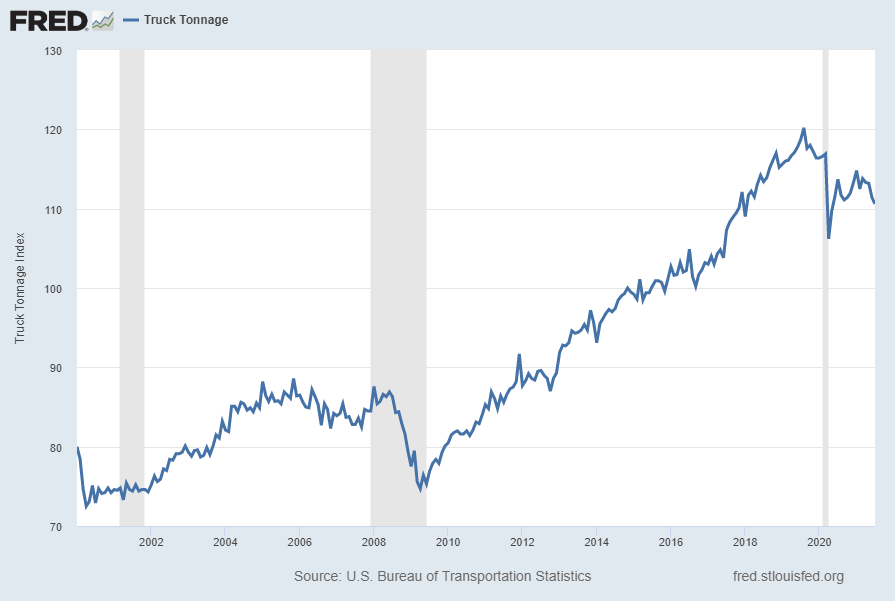
Truck Tonnage (TRUCKD11)
“Truck Tonnage” (TRUCKD11) has recently been exhibiting weakness. Shown below is this measure with last value of 110.6 through July, last updated September 28, 2021:
Below is this measure displayed on a “Percent Change From Year Ago” basis with value -2.7%:

source: U.S. Bureau of Transportation Statistics, Truck Tonnage [TRUCKD11], retrieved from FRED, Federal Reserve Bank of St. Louis; accessed October 12, 2021: https://fred.stlouisfed.org/series/TRUCKD11
__
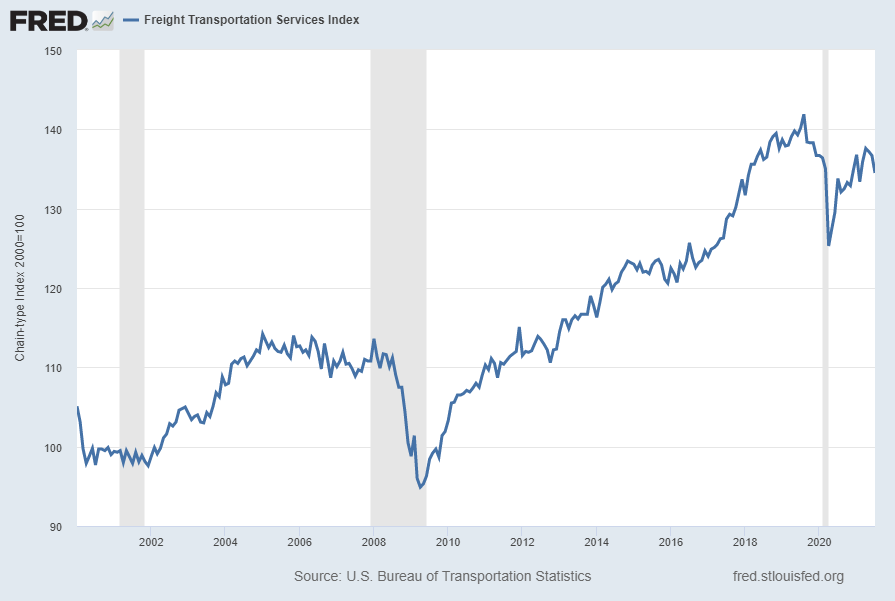
Freight Transportation Services Index (TSIFRGHT)
“Freight Transportation Services Index” (TSIFRGHT) also has recently been exhibiting weakness. Shown below is this measure with last value of 134.5 through July, last updated September 23, 2021:
Below is this measure displayed on a “Percent Change From Year Ago” basis with value .5%:
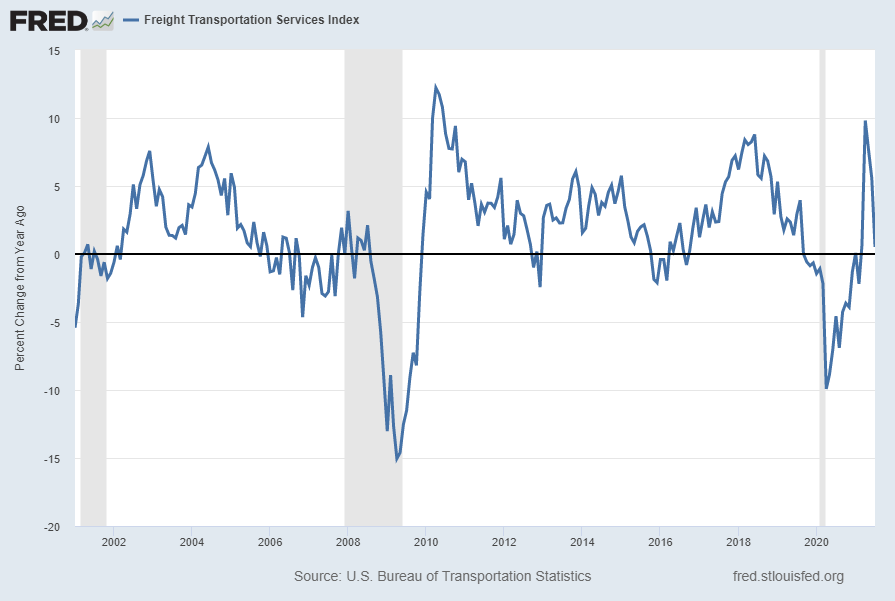
source: U.S. Bureau of Transportation Statistics, Freight Transportation Services Index [TSIFRGHT], retrieved from FRED, Federal Reserve Bank of St. Louis; accessed October 12, 2021: https://fred.stlouisfed.org/series/TSIFRGHT
__
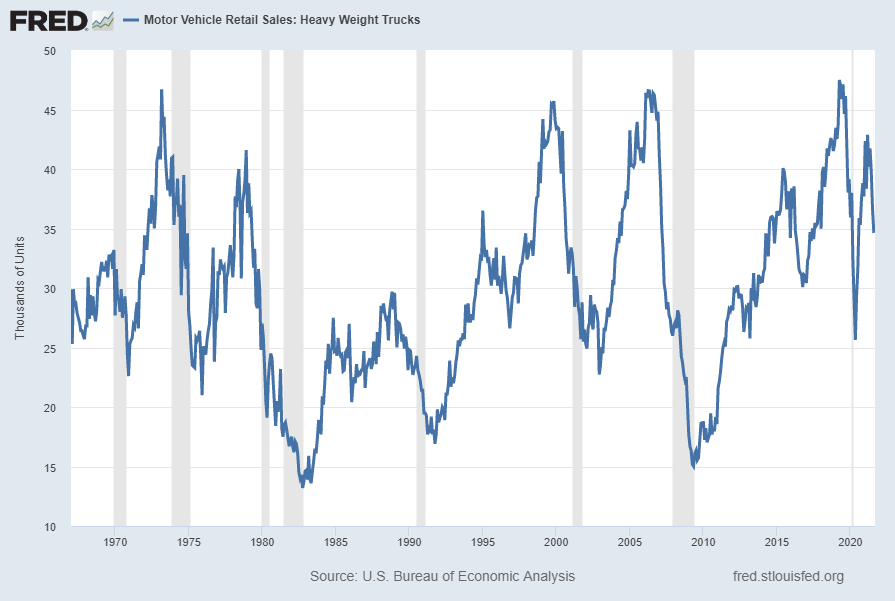
Motor Vehicle Retail Sales: Heavy Weight Trucks (HTRUCKSSA)
Sales of “Heavy Weight Trucks” (HTRUCKSSA) has recently been declining. Shown below is this measure with last value of 34.774 Thousand through September 2021, last updated October 8, 2021:
Below is this measure displayed on a “Percent Change From Year Ago” basis with value -1.5%:
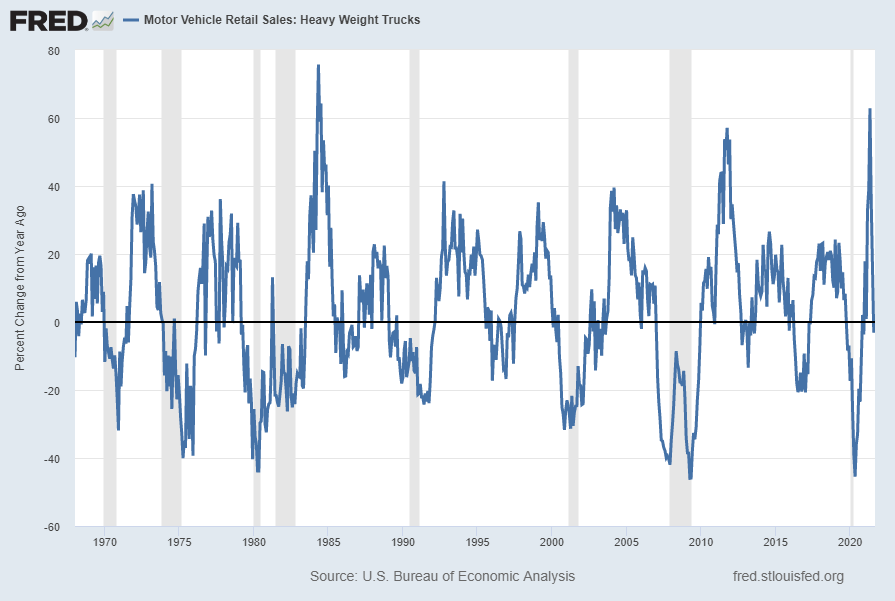
source: U.S. Bureau of Economic Analysis, Motor Vehicle Retail Sales: Heavy Weight Trucks [HTRUCKSSA], retrieved from FRED, Federal Reserve Bank of St. Louis; accessed October 12, 2021: https://fred.stlouisfed.org/series/HTRUCKSSA
__
Other Indicators
As mentioned previously, many other indicators discussed on this site indicate economic weakness or economic contraction, if not outright (gravely) problematical economic conditions.
_____
The Special Note summarizes my overall thoughts about our economic situation
SPX at 4350.65 as this post is written